

- ONDO fell below the $0.83 support level and retested it as resistance.
- The momentum has shifted in bearish favor.
Ondo [ONDO] fell from the recent swing high at $1.05 to trade at $0.901 at press time, a 23% decline in just over two days.
The crypto market was overwhelmed by selling pressure, but most tokens retained their bullish long-term outlook.
ONDO was in a similar vein. While its indicators showed bears were gaining superiority, the price action showed that the bulls were comfortable despite the recent volatility.
The short-term support level was flipped to resistance
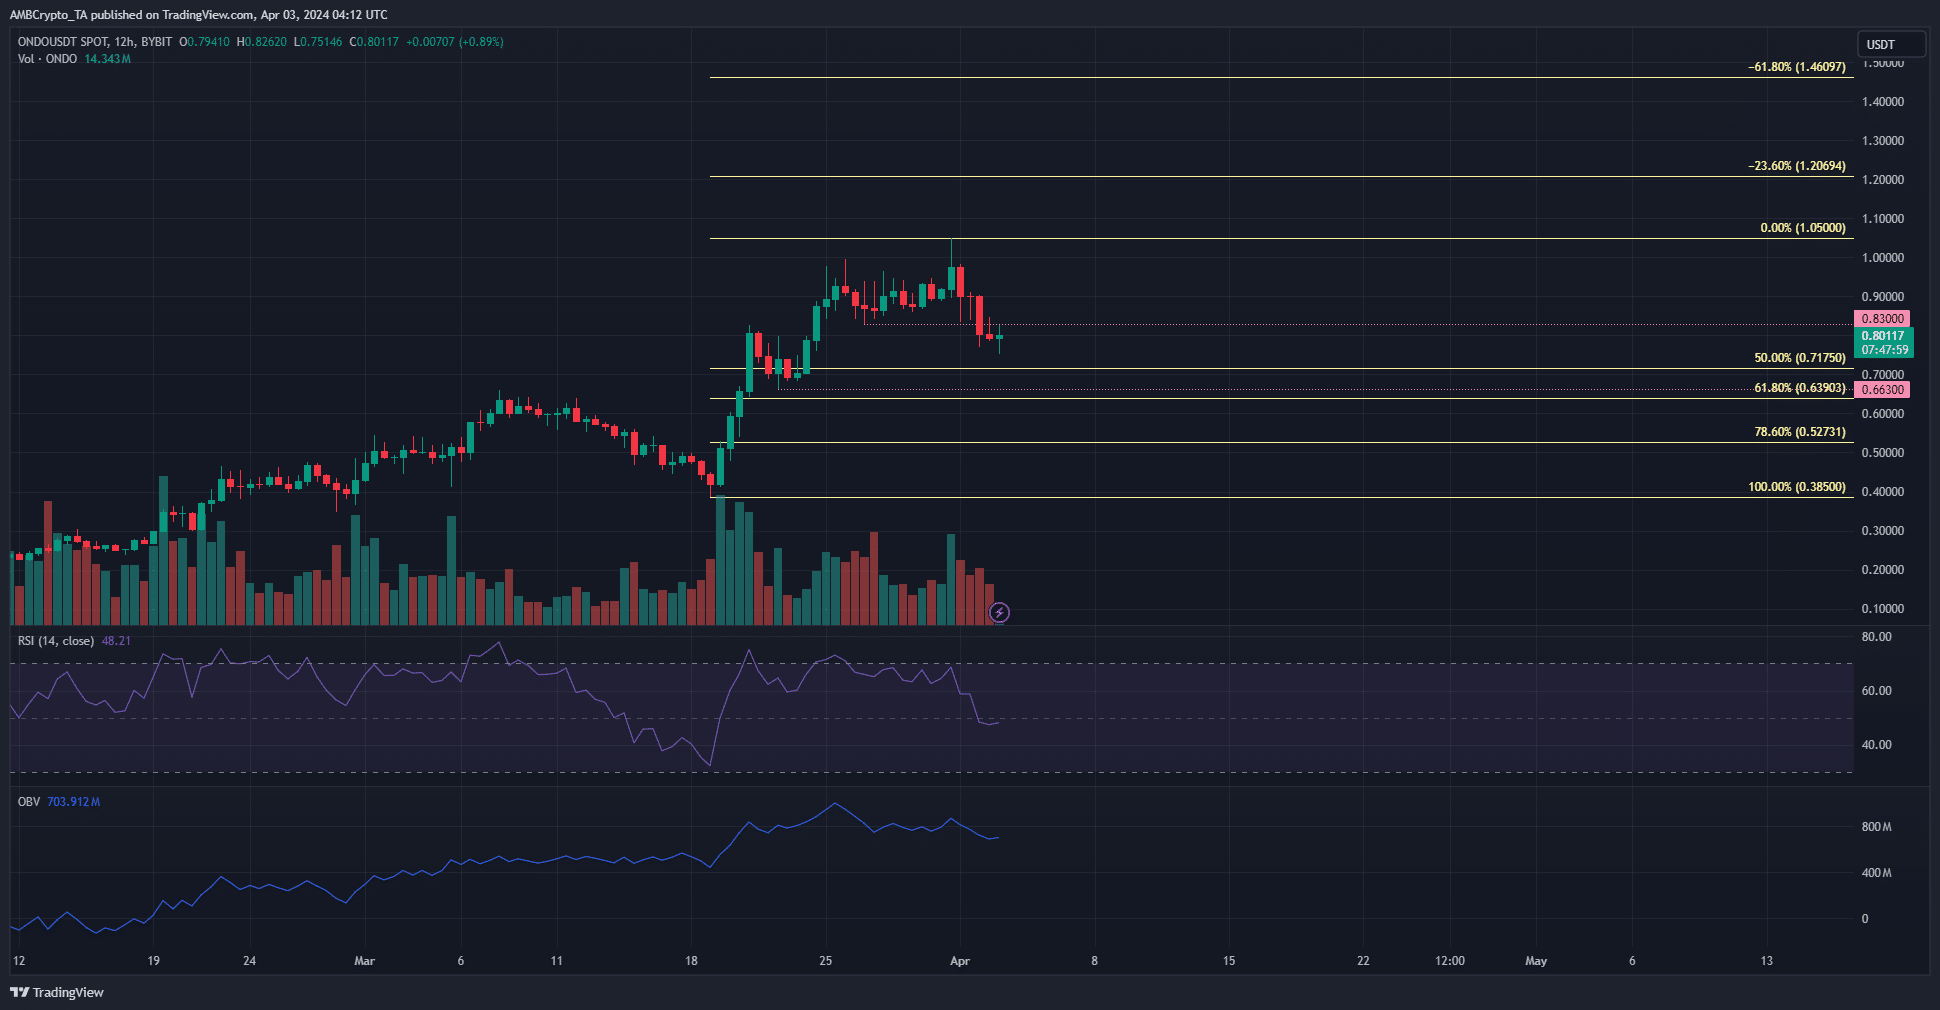
Source: ONDO/USDT on TradingView
Two lower timeframe support levels were highlighted in pink at $0.83 and $0.663. On the 12-hour chart, the swing low at $0.385 is the one to beat to flip the structure bearishly.
The Fibonacci retracement levels (pale yellow) also underlined key support levels.
The $0.527 and $0.639 were the most pertinent ones for ONDO bulls. The RSI showed that the momentum had shifted bearishly.
The OBV did not sink below the mid-March lows but has trended downward over the past week.
The trading volume was also declining, which could herald a phase of consolidation for the token. At press time, the bulls have no reason to panic.
A sharp decline would be welcome, as it would offer a buy-and-hold opportunity for the long term.
Should investors wait for such a drop?
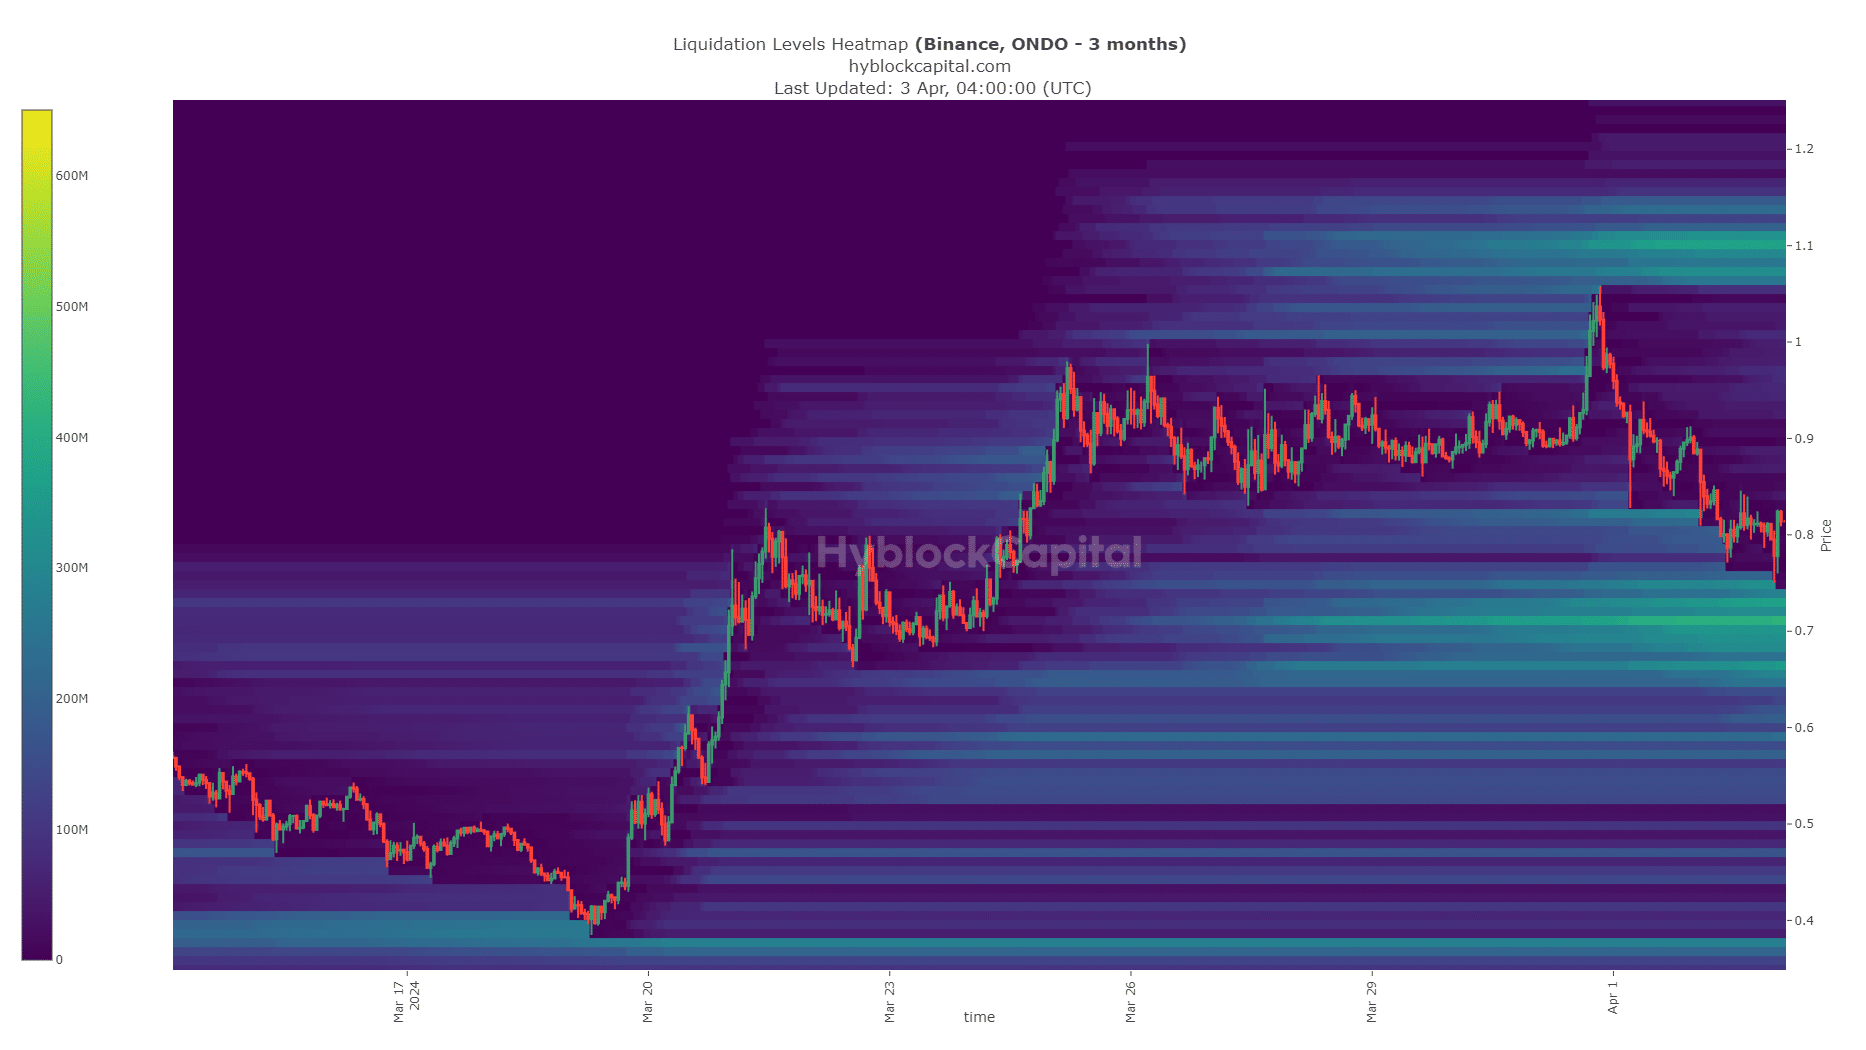
The liquidation heatmap showed that the $0.7 area has a large amount of liquidation levels. The area from $0.69-$0.74 could see the trend reverse after ONDO prices sweep the liquidity pocket.
Below $0.69, the $0.59 and the $0.37 levels were the ones to watch. Therefore, unless the $0.69-$0.71 support zone is breached, holders need not worry much about a steep retracement.
Is your portfolio green? Check the ONDO Profit Calculator
Meanwhile, the $1.1 was an attractive target for the bulls. However, the short-term momentum would need to change before this liquidity pocket becomes the next target.
A move to $0.69 followed by a surge to $1.1 or higher would take out both pools of concentrated liquidation levels.
Disclaimer: The information presented does not constitute financial, investment, trading, or other types of advice and is solely the writer’s opinion.