

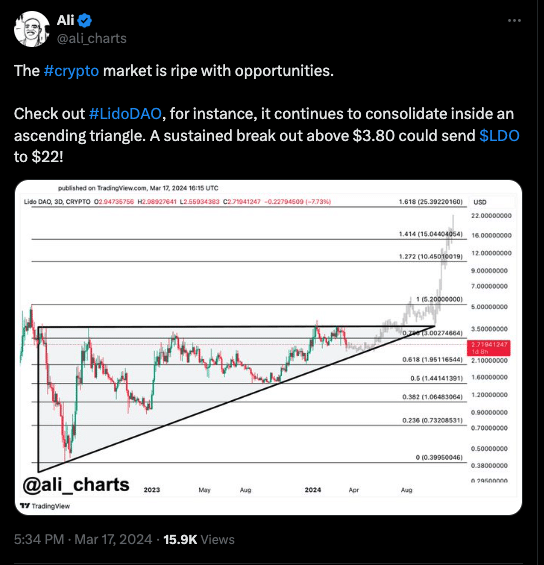
- The 3-day price analysis revealed that LDO might jump to $22.
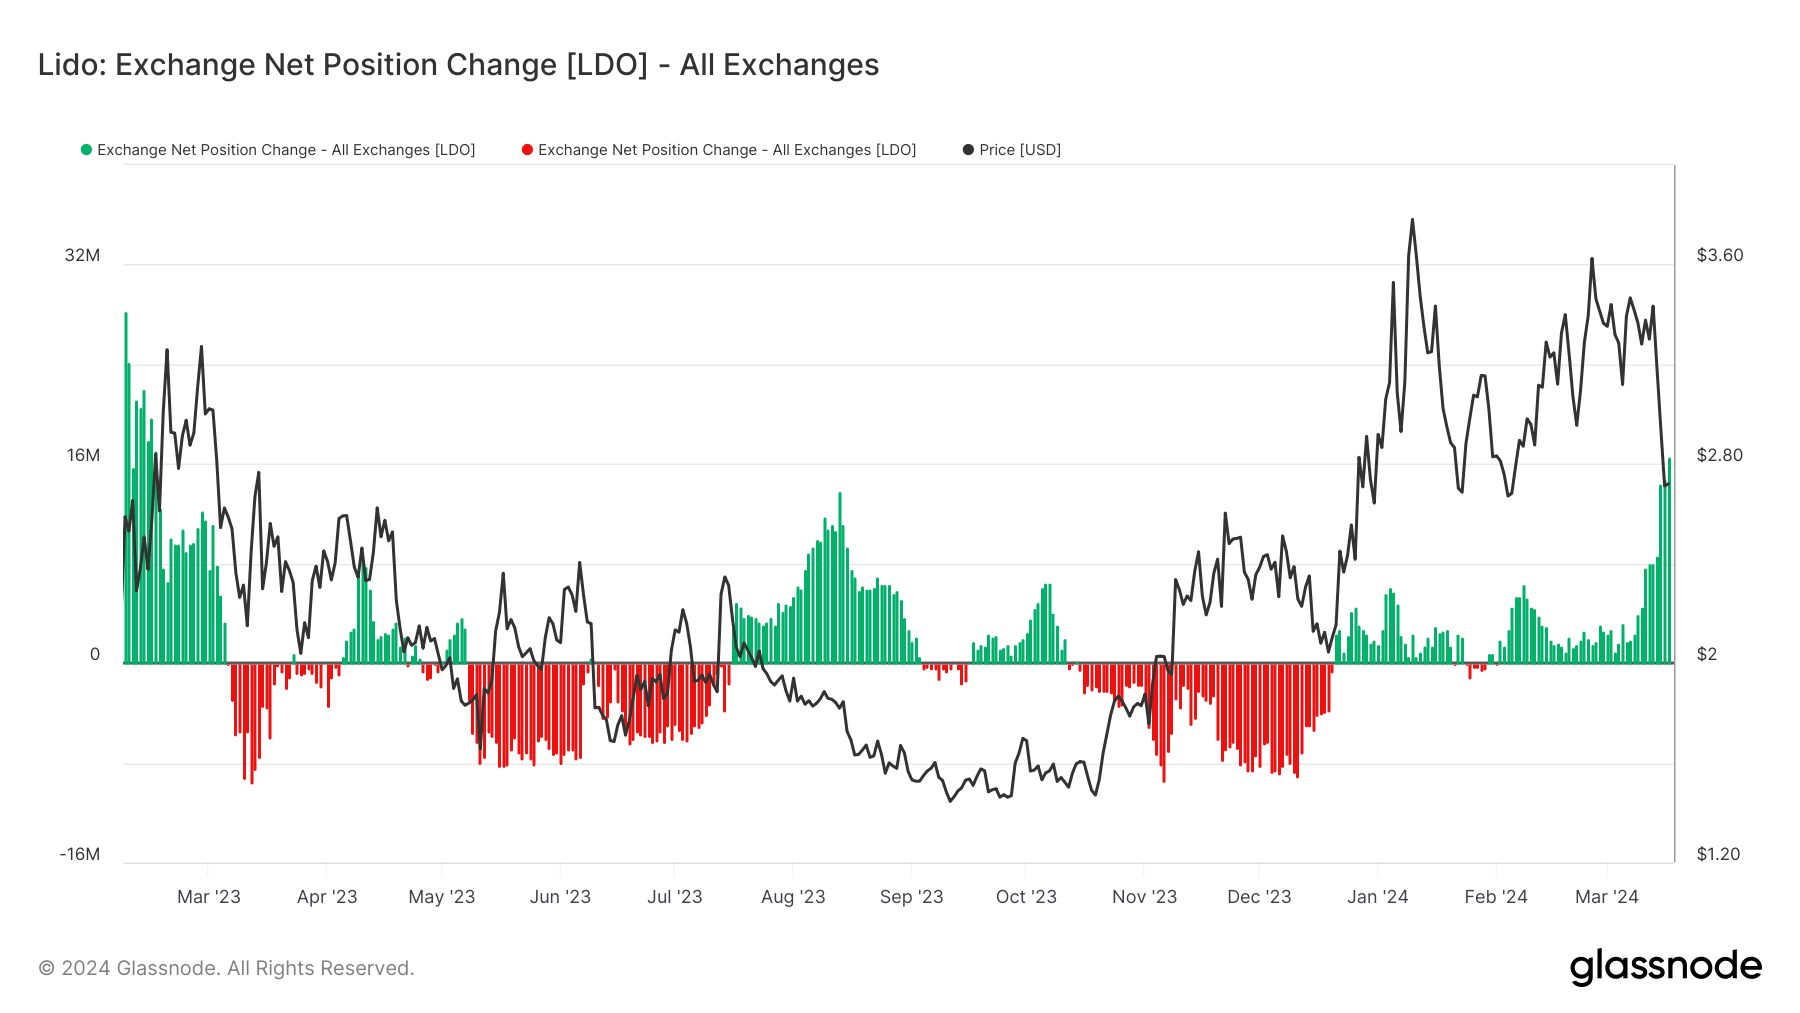
- Capital inflow increased, suggesting that the downtrend time was up.
Lido DAO [LDO], the native token of liquid staking project Lido Finance, could be set to break out of its consolidation phase. If that happens, LDO’s price could rally to $22, analyst Ali Martinez noted.
Martinez pointed this out after evaluating Lido’s 3-day chart. According to the chart, LDO had formed an ascending triangle. But for the price to hit double-digits, it has to break through $3.80.
Source: X
Frail bears may be leaving the token but…
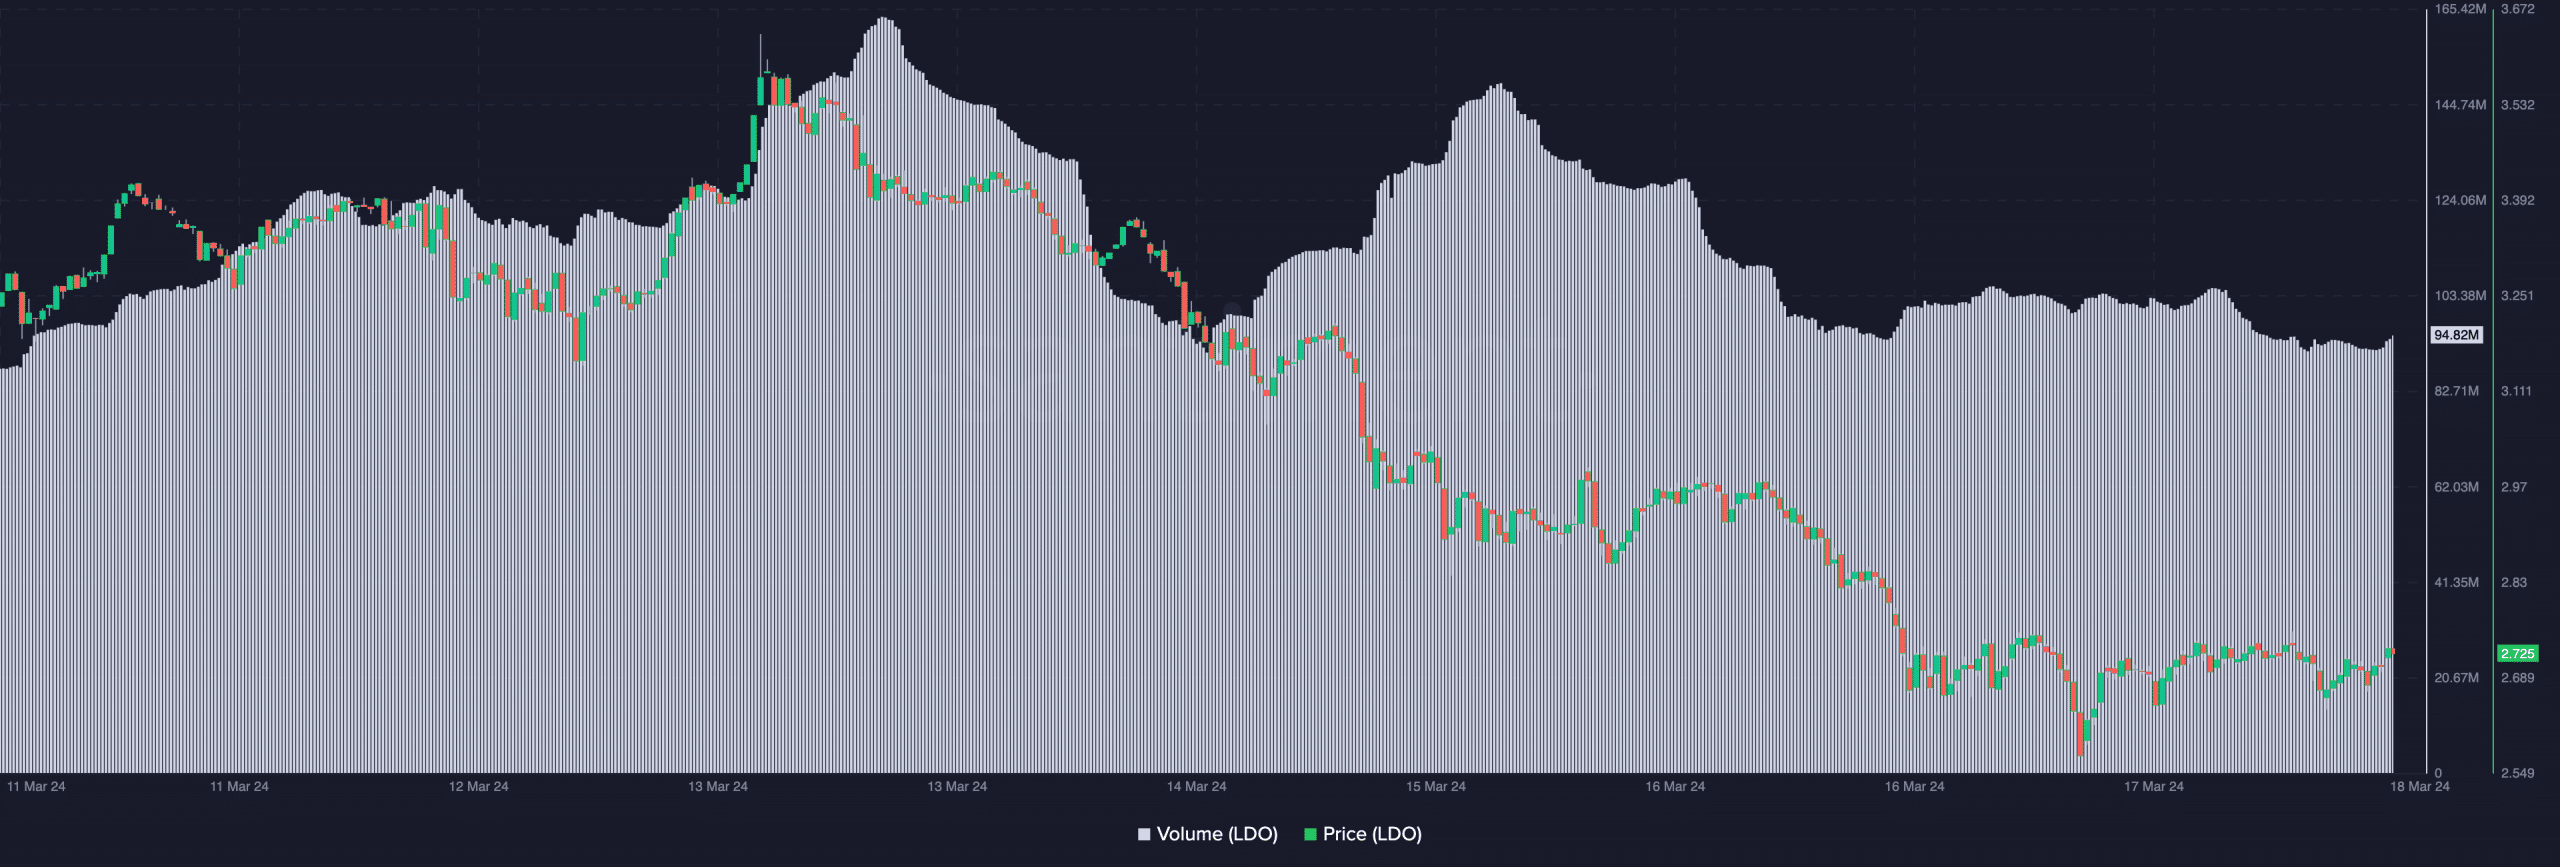
At press time, the cryptocurrency changed hands at $2.72, representing a 16.93% decrease in the last seven days. AMBCrypto also noticed that the volume has been decreasing.
Falling volume alongside a decreasing price could indicate that the downtrend was getting weak. Should this continue, the price of LDO might reverse in the upward direction.
Source: Santiment
For the short term, it is important to check if the value can hit $3.80 for a start. To do this, we analyzed the Exchange Net Position Change using Glassnode, an on-chain data provider.
For those unfamiliar, the Exchange Net Position Change measures the 30-day flow of assets that have entered or exited exchanges.
If the metric is negative, then it means exchanges have more outflows than inflows.
Concerning the price, this condition would have been a bullish signal, as it would indicate less selling pressure. However, Lido’s Exchange Net Position Change was 16.64 million tokens at press time.
A value like this indicates high exchange inflow, which could have played a part in the recent drawdown.
Furthermore, the state of the metric at press time suggested that LDO might see more downswing before it breaks out.
Source: Glassnode
LDO to hit $7.15 soon?
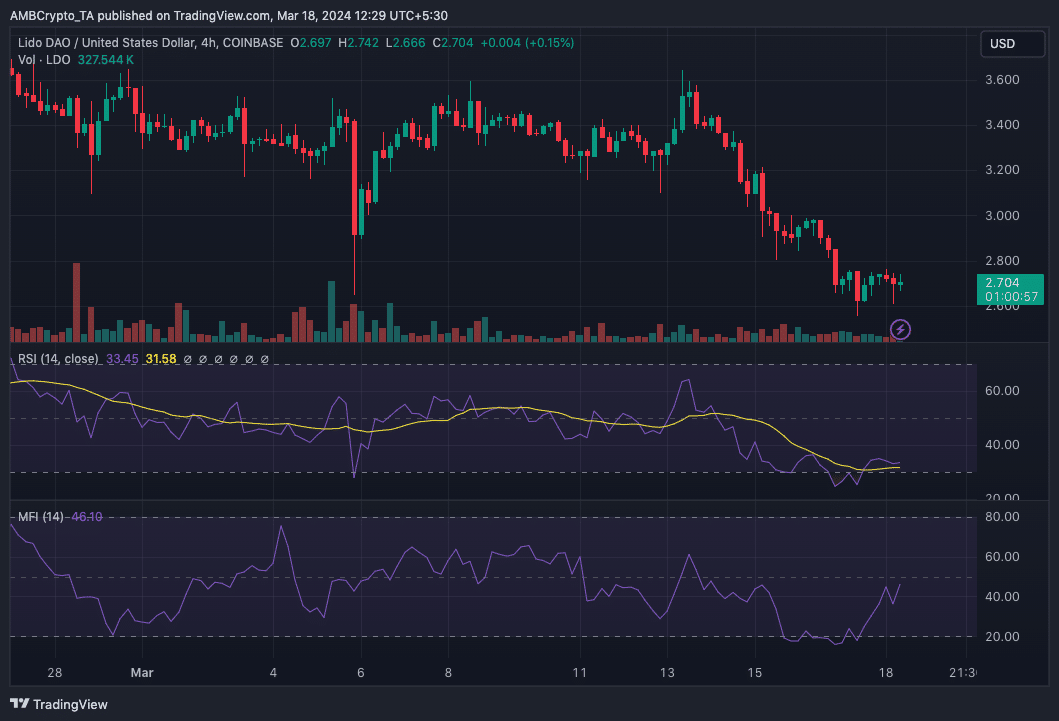
Beyond on-chain analysis, AMBCrypto also evaluated LDO from a technical standpoint.
According to the LDO/USD 4-hour chart, the token’s momentum had become extremely bearish as shown by the Relative Strength Index (RSI).
At press time, the RSI was 33.45, reinforcing the notion that sellers were in control. However, the declining oscillator reading could be good for LDO.
That is, if the RSI falls below 30.00 where it could be considered oversold.
If the token becomes oversold, then a bullish reversal could be on the cards.
Should buying pressure appear when LDO hits the oversold region, the Fibonacci indicator showed that the price might rally as high as $7.15 in the midterm.
Furthermore, an assessment of the Money Flow Index (MFI) showed that LDO might experience notable changes soon.
On the 17th of March, the MFI was around the oversold region, indicating a massive outflow of capital.
Source: TradingView
Realistic or not, here’s LDO’s market cap in ETH’s terms
But as of this writing, it was no longer the case, as the reading was 46.10. A spike in the MFI within such a short period could be evidence that a price increase was close.
Should funds continue to flow into the LDO market, then a rise beyond $3.80 could occur within a few days.