

- Hedera Hashgraph has seen a six-day consecutive decline.
- HBAR might retrace to its old price range soon.
Hedera [HBAR] experienced a surge in price recently, reaching one of its highest points in months. However, once the initial confusion subsided, the price began to retrace, and the heightened sentiment quickly cooled off.
HBAR continues to decline
The Hedera daily price trend exhibited intriguing patterns, which may not be so intriguing for holders. Initially, from 20th to 22nd April, the price followed a relatively stable trajectory, moving from around $0.08 to $0.09.
However, a significant surge occurred on 23rd April, with HBAR witnessing a staggering 73.65% increase, pushing the price to $0.15.
This surge, resembling a parabolic rise, was triggered by a now-deleted Hedera Foundation post announcing a tokenization move involving Blackrock.
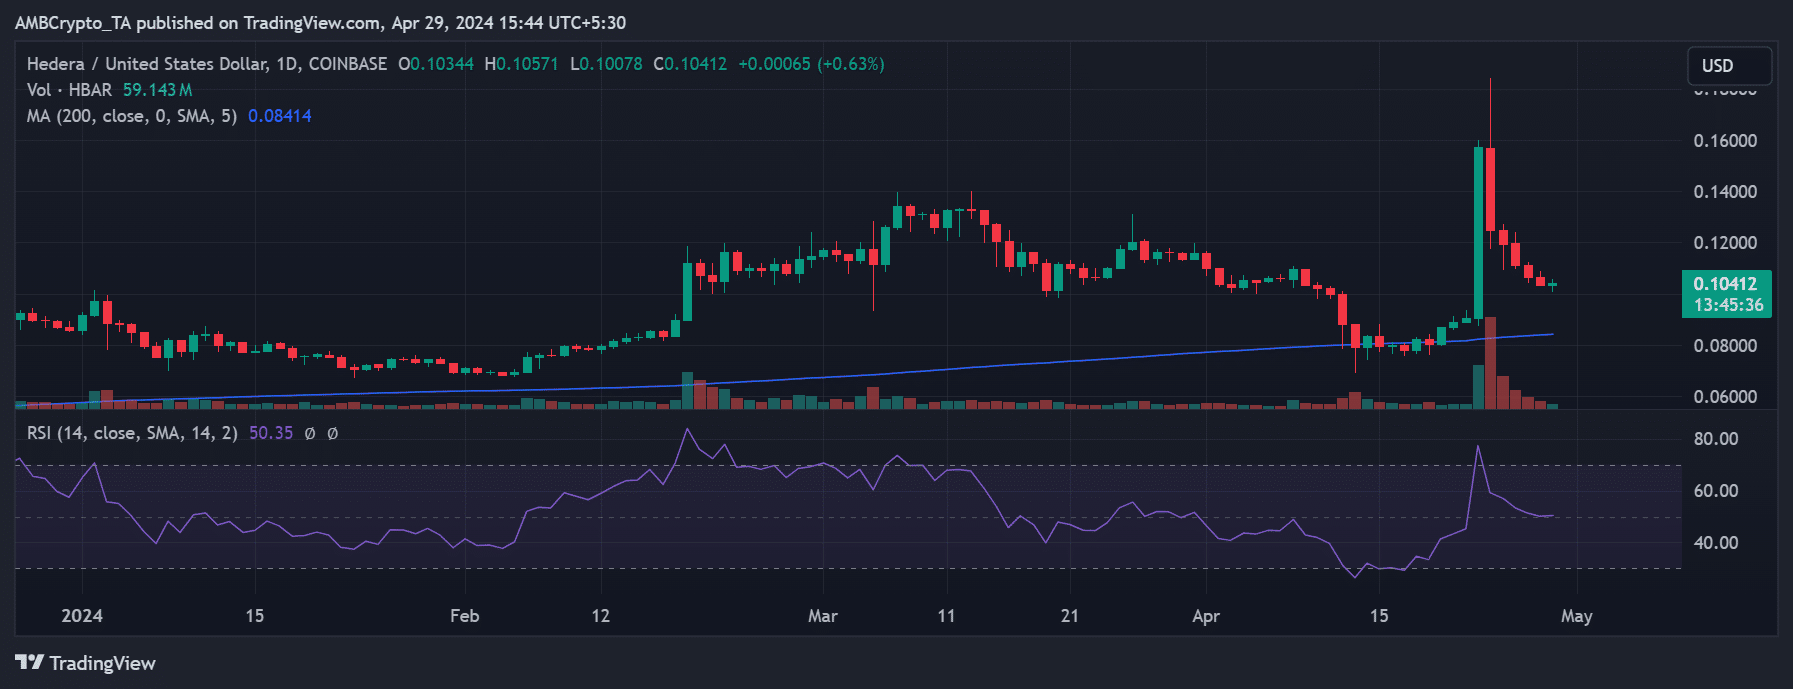
Source: TradingView
Subsequently, on 24th April, the price began to decline, experiencing a 20.58% drop and settling at $0.12. The decline marked the onset of consecutive decreases, bringing the price back to its pre-surge range.
Interestingly, this decline coincided with a clarification post from Archax CEO Graham Rodford regarding the Blackrock tokenization announcement. HBAR traded in the $0.10 price region as of the latest update.
Despite the significant price downturn, HBAR has maintained a bullish trend, albeit weakening, with its Relative Strength Index remaining above the neutral line.
Hedera sees massive volume and market cap decline
Analysis of the volume metric on Santiment revealed significant surges coinciding with the two major price moves of Hedera. During the surge of over 70% in price, the volume spiked to over $1 billion from an average of $50 million.
Similarly, as the price declined on 24th April, the volume surged to over $3.5 billion before gradually decreasing. As of the latest update, the volume was around $135 million.
According to data from CoinMarketCap, the volume has decreased by almost 7% in the last 24 hours.
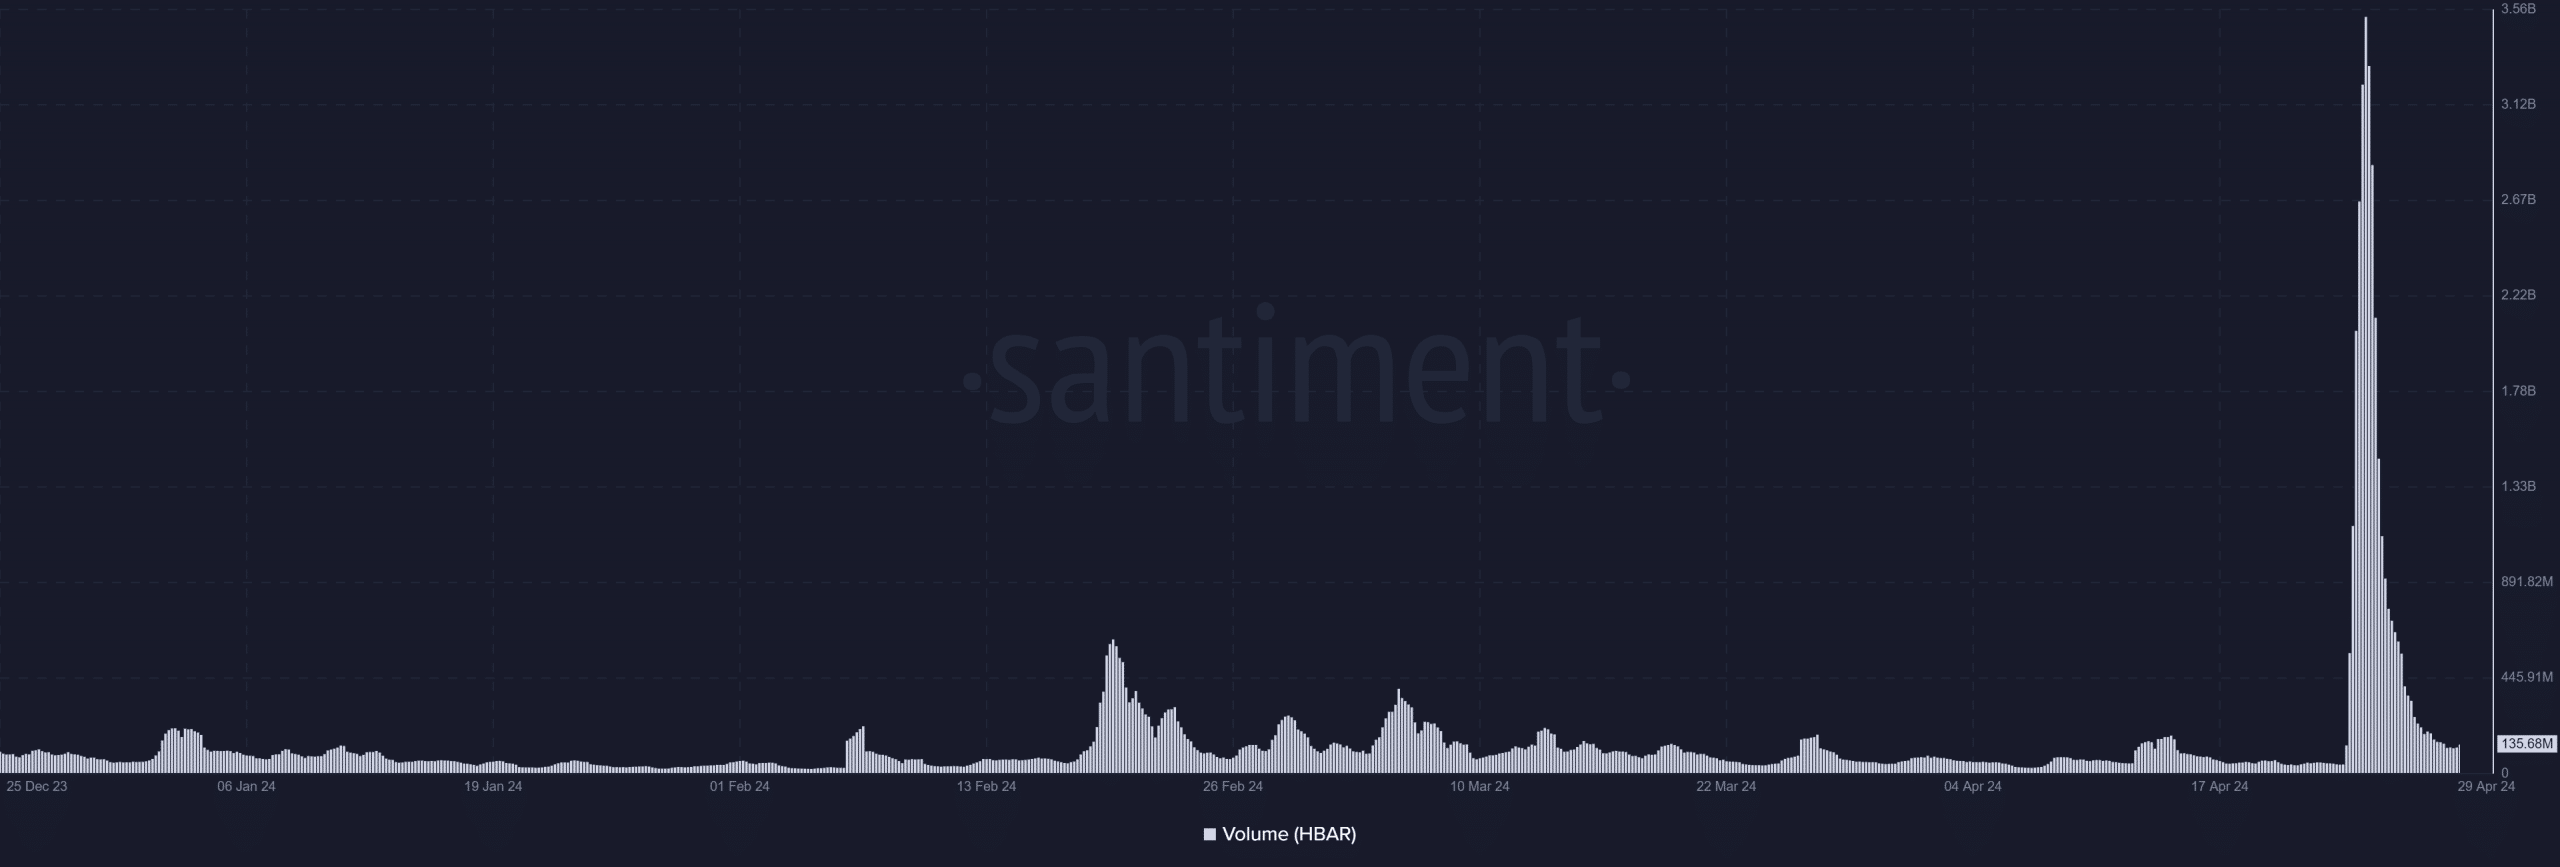
Source: Santiment
Additionally, market capitalization experienced notable fluctuations that corresponded to price movements. During the price spike of over 70%, the market cap surged to over $6 billion from around $3.2 billion.
As of this writing, the market cap was around $3.6 billion. CoinMarketCap data also indicated a nearly 2% reduction in market cap over the past 24 hours.
A sharp drop in Hedera’s interest
The surge in price experienced by Hedera attracted significant cash inflow, as indicated by the Open Interest metric on Coinglass, which soared to over $147 million by 25th April.
However, this surge in interest has since declined, with the metric sharply declining. 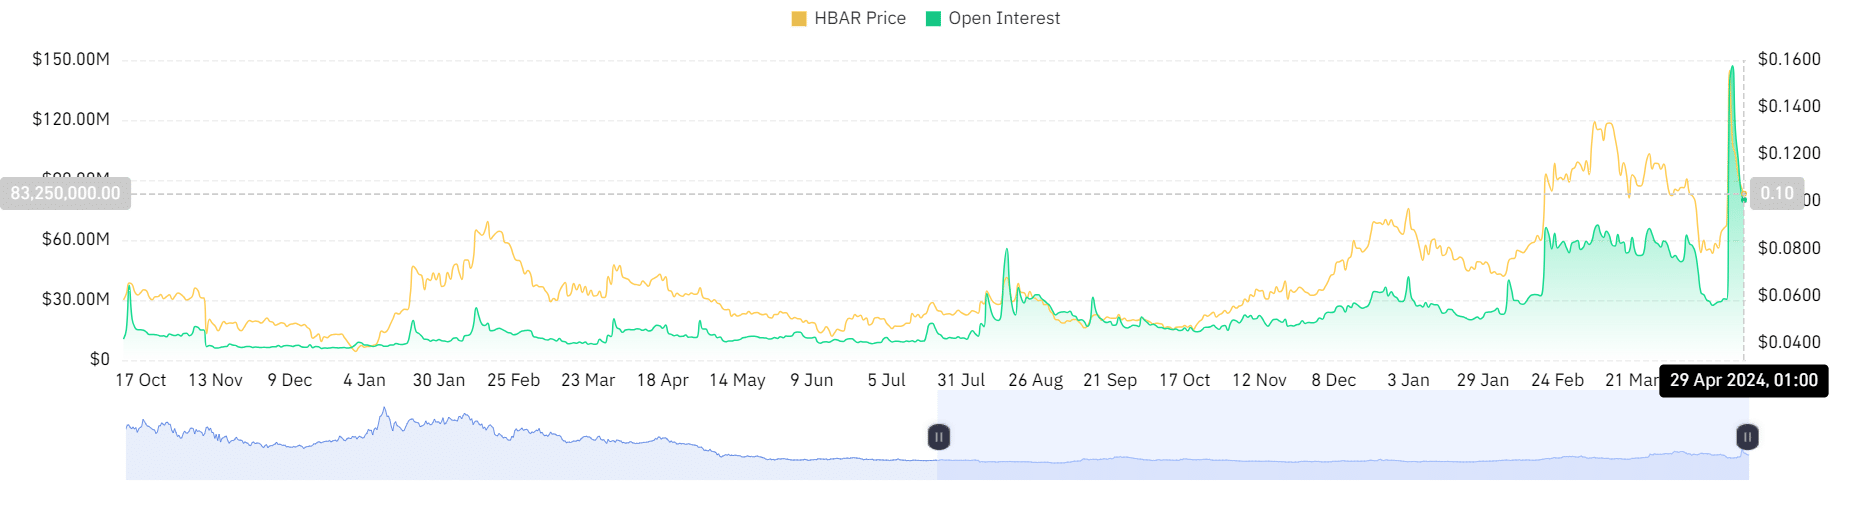
Source: Coinglass
Is your portfolio green? Check out the Hedera Profit Calculator
As of this writing, the Open Interest was around $80 million, suggesting a reduction in cash flow into HBAR.
This decline in Open Interest indicates a waning interest in Hedera Graph, signalling the conclusion of the short-lived positive run that the asset experienced.