

- Bitcoin was up by more than 4% in the last 24 hours.
- A few technical indicators and metrics looked bearish.
Bitcoin [BTC] regained its bullish momentum over the last few hours, as the king coin’s value surpassed the $70k mark after plummeting under $66k.
In the meantime, BTC’s long-term investors managed to take some profits during the latest price pump.
Bitcoin touches $70k
According to CoinMarketCap, BTC was up by 3% in the last seven days. In fact, over the last 24 hours, its value surged by over 4%.
At the time of writing, BTC was trading at $70,310.91 with a market capitalization of over $1.38 trillion.
While the coin’s price rose, SimonaD, an author and analyst at CryptoQuant, posted an analysis highlighting long-term investor actions.
As per the analysis, the Long-Term Holder Spent Output Profit Ratio is a crucial metric used in analyzing market trends and investor behavior, particularly among long-term investors.
The analysis chart showed that the Bitcoin long-term holder SOPR (EMA 144) had more spikes since the beginning of March.
This means that investors took some profits along the way as the price reached new highs.
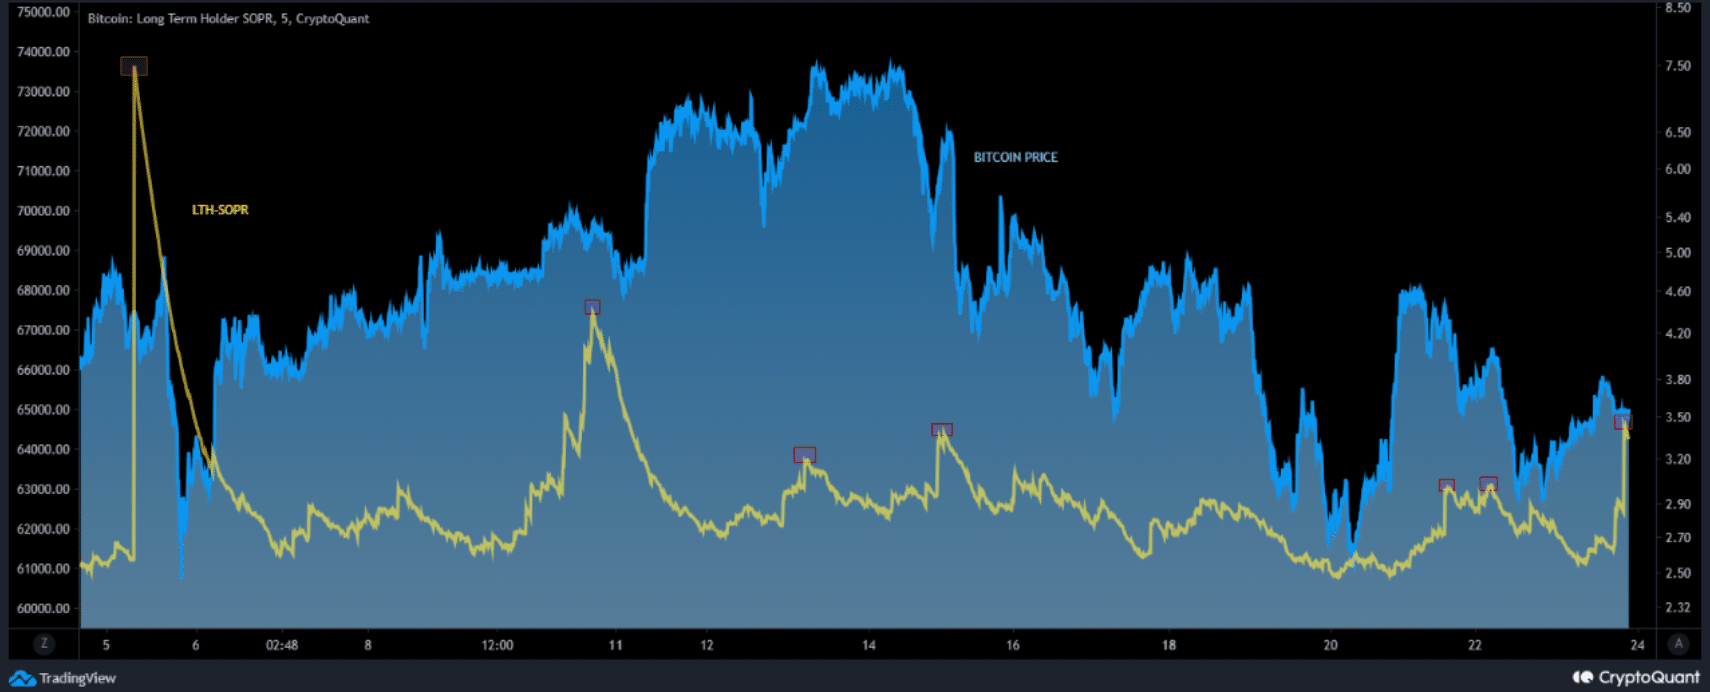
Source: CryptoQuat
In fact, long-term holders continued to be more active as per the latest data as well. AMBCrypto’s analysis of CryptoQuant’s data revealed that BTC’s Binary CDD was red.
This meant that long-term holders’ movements in the last seven days were higher than average. If they were moved for the purpose of selling, it may have a negative impact.
Also, selling sentiment in general seemed to have been dominating the market as BTC’s net deposit on exchanges was high compared to the last seven-day average, which might cause a price correction soon.
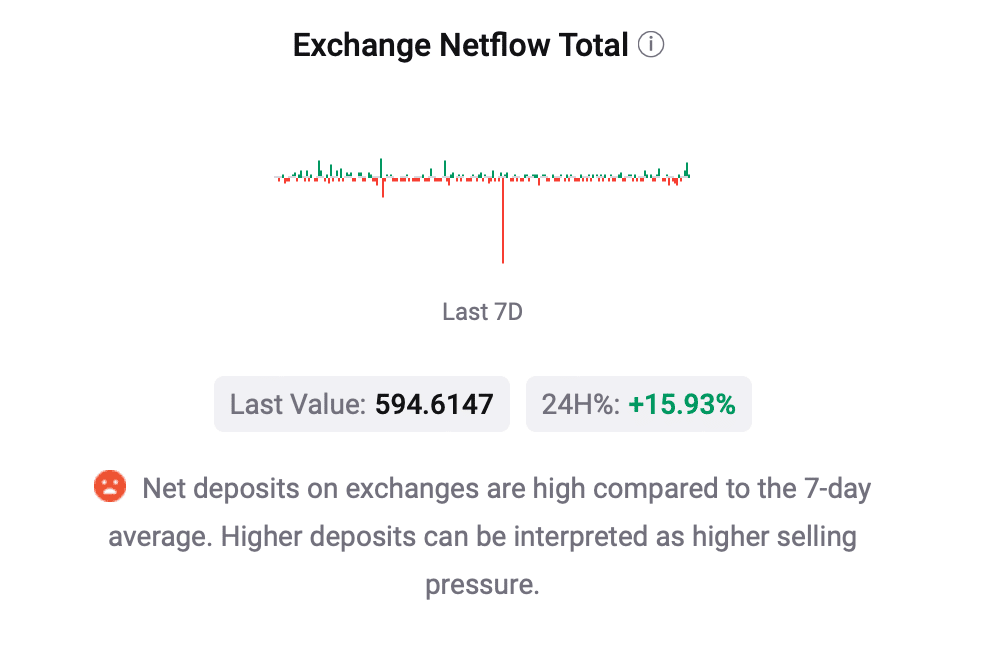
Source: CryptoQuant
Which way is BTC headed?
AMBCrypto’s analysis of Hyblock Capital’s data pointed out that a substantial amount of BTC could be liquidated when its value touches the $71,750 mark.
Since liquidation will rise, that level might be a resistance for BTC, which might cause a short-term price decline.
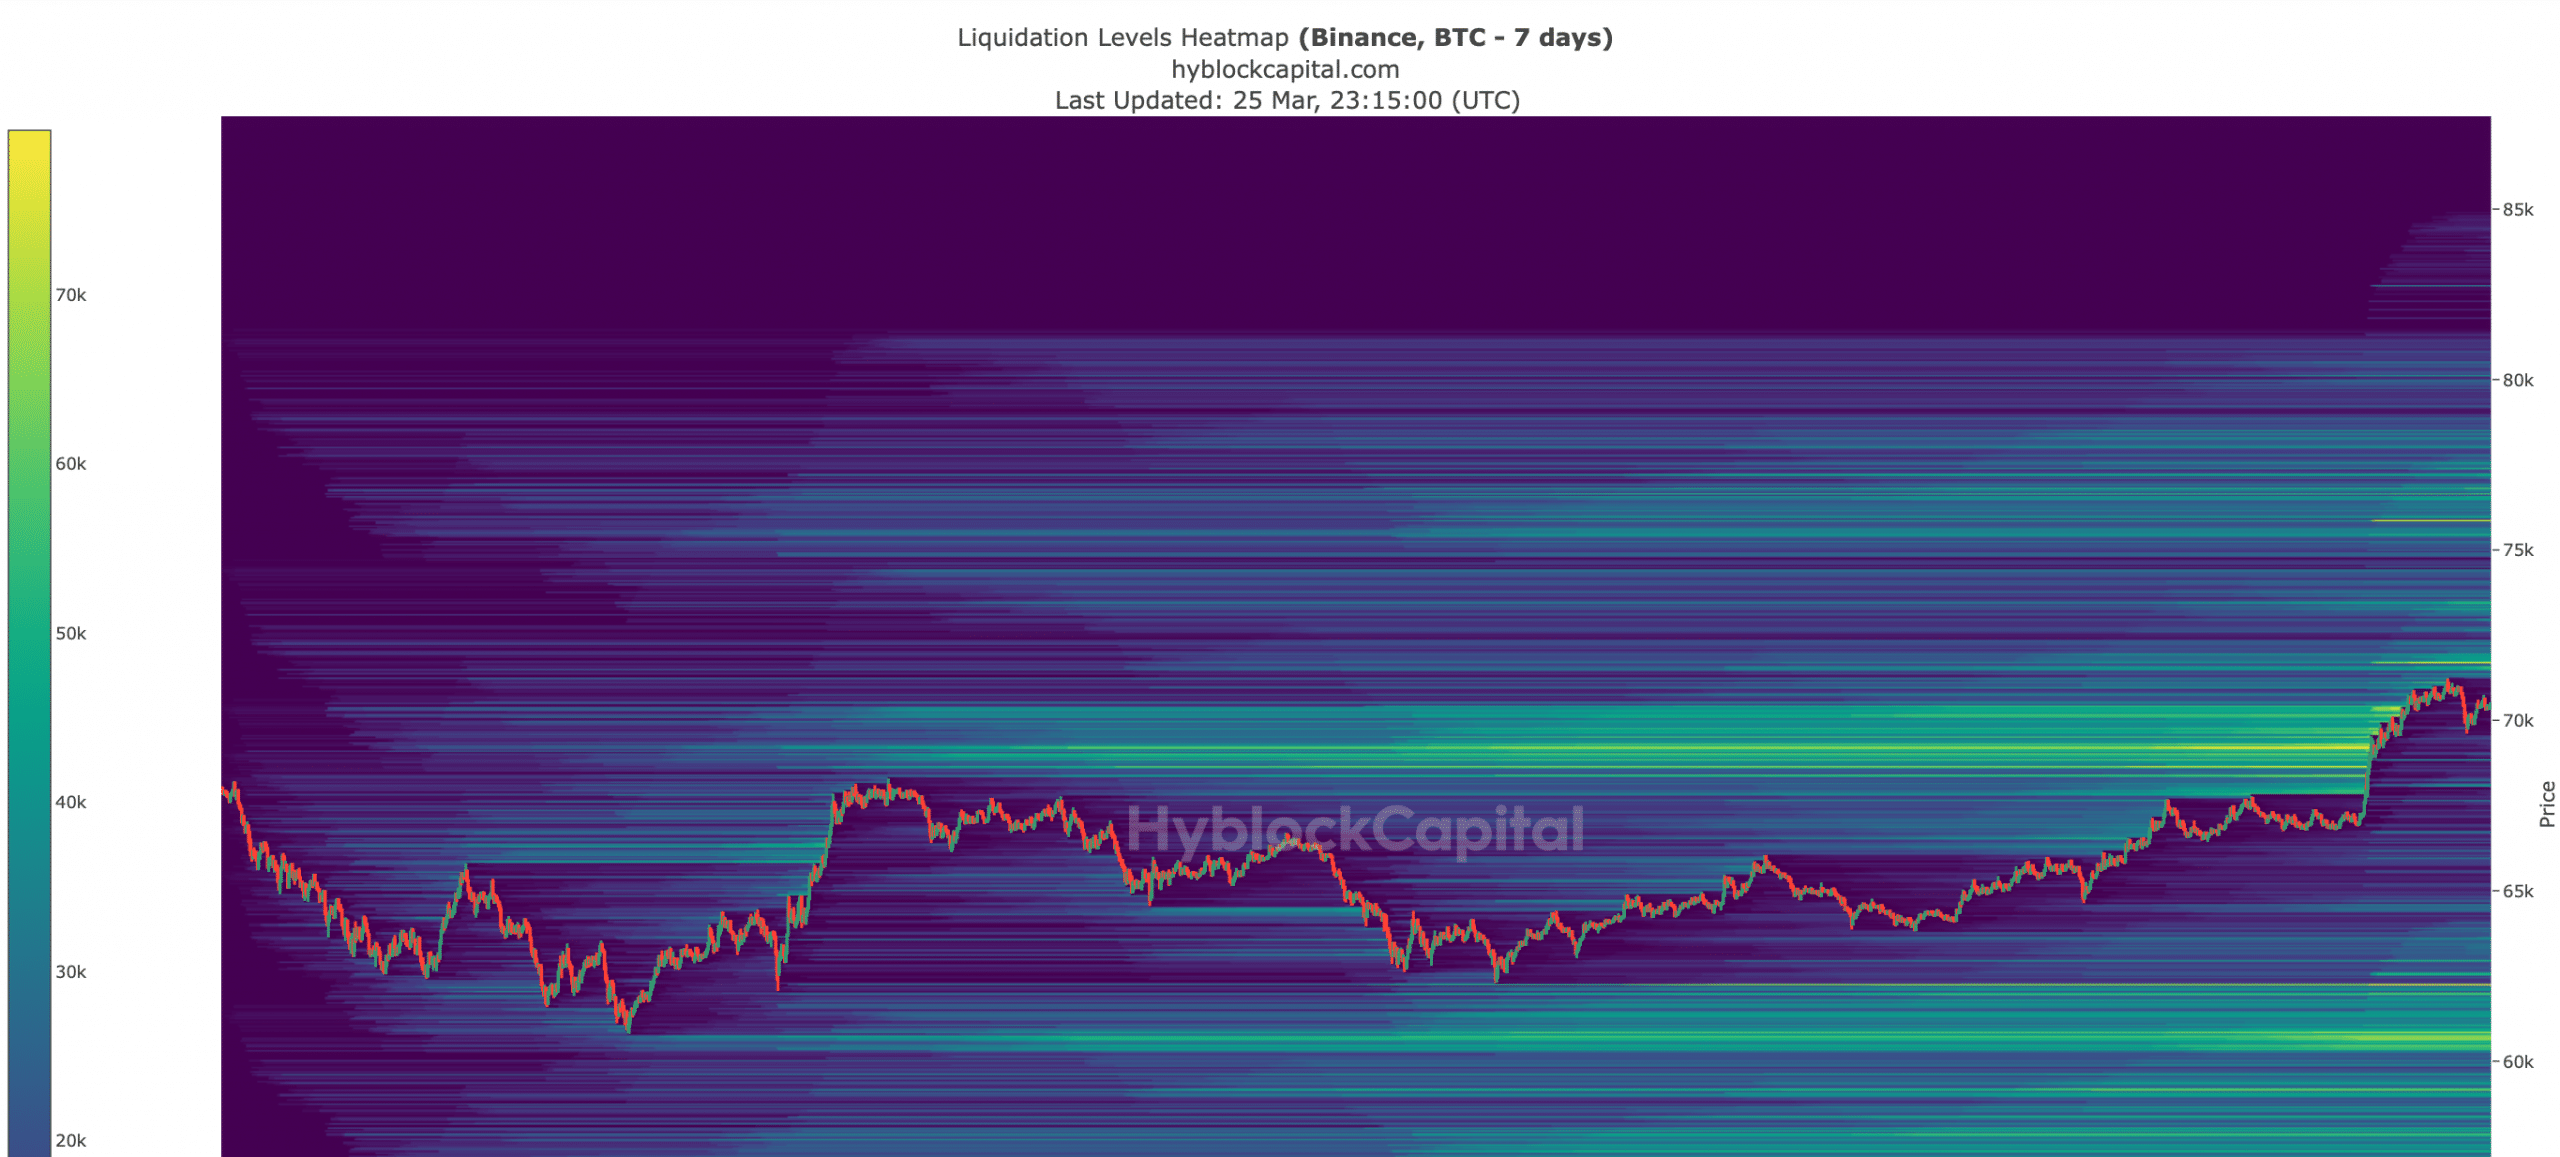
Source: Hyblock Capital
To better understand which way BTC was headed, AMBCrypto then checked its daily chart. As per our analysis, BTC’s price moved above its 20-day SMA, as displayed by the Bollinger Bands.
Read Bitcoin’s [BTC] Price Prediction 2024-25
The technical indicator MACD also displayed the possibility of a bullish crossover in the coming days.
These indicators suggested that BTC was getting ready for a further bull rally. Nonetheless, BTC’s growth momentum might decline as its Money Flow Index (MFI) moved sideways in the last few days.
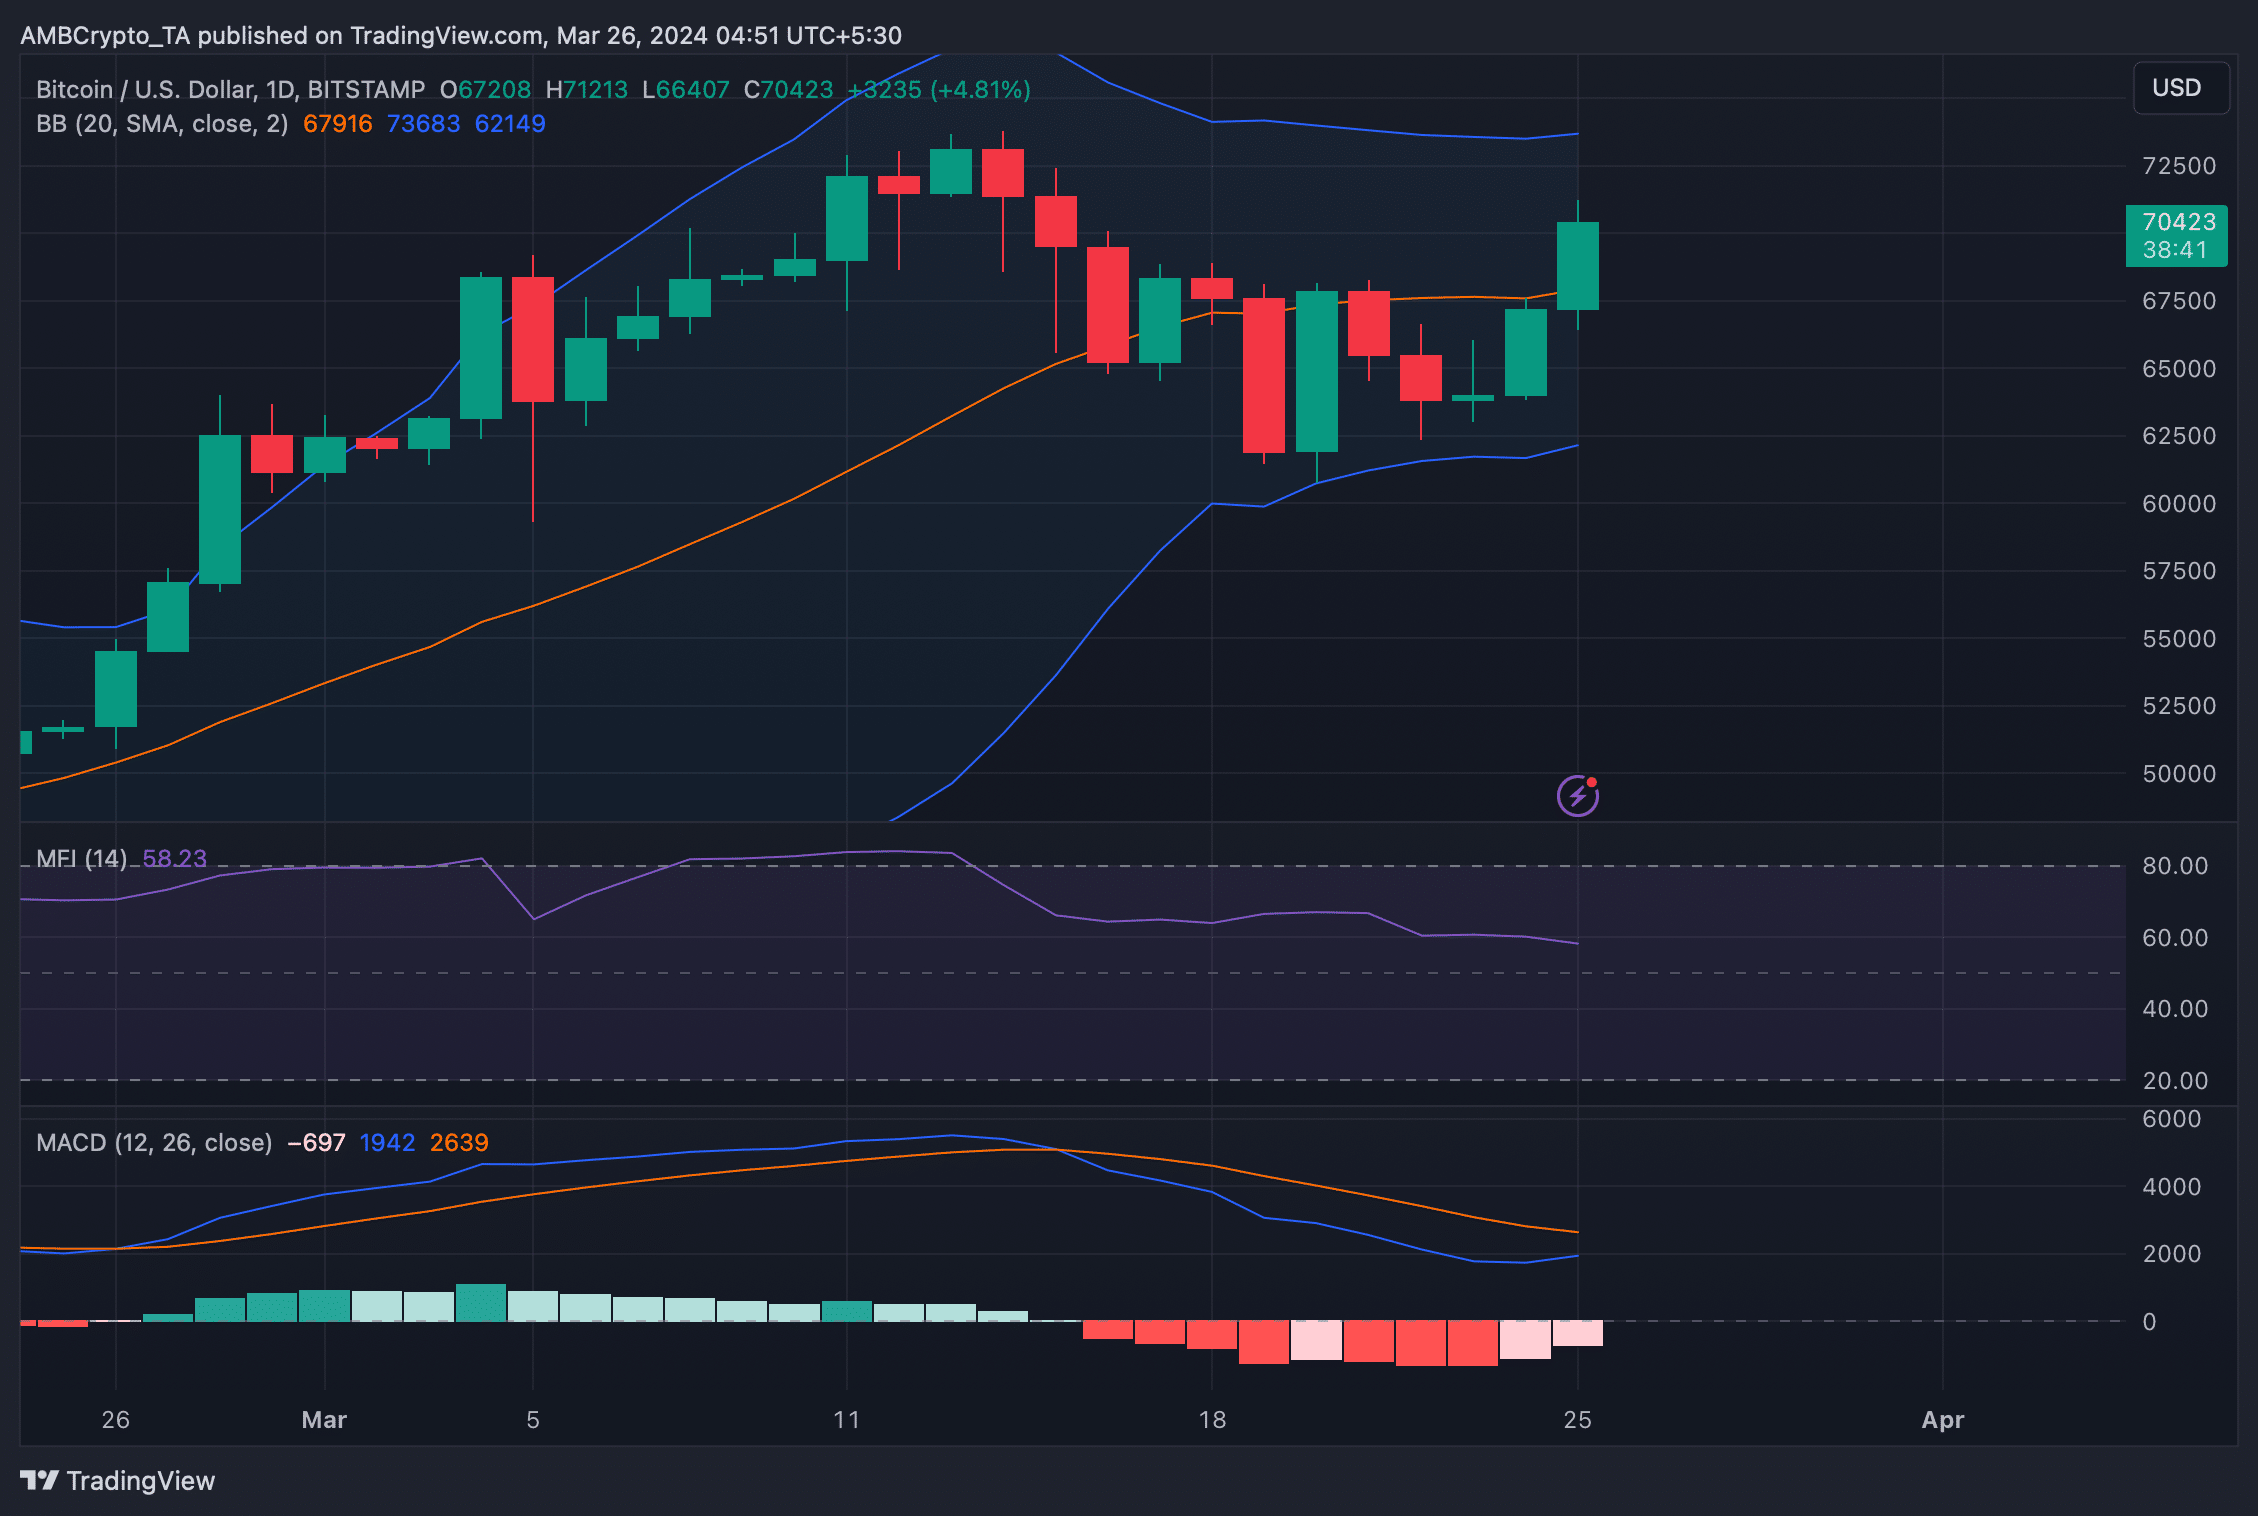
Source: TradingView