- Bitcoin’s price has increased by over 12% in the last seven days.
- Metrics suggested that BTC might turn bearish even before retesting its ATH.
Bitcoin [BTC] has finally entered its road towards recovery as it crossed the psychological resistance of $60k. The rise in its price hinted at a retest of its all-time high in the coming days.
However, the coin would face a roadblock right after its ATH as it would witness a major rise in liquidation.
Bitcoin to retest its ATH?
CoinMarketCap’s data revealed that BTC’s price increased by double digits last week. To be precise, the king of cryptos witnessed a 12% price rise in the past seven days.
In the last 24 hours alone, the coin’s price shot up by more than 4%. At the time of writing, BTC was trading at $62,543.73 with a market capitalization of over $1.23 trillion.
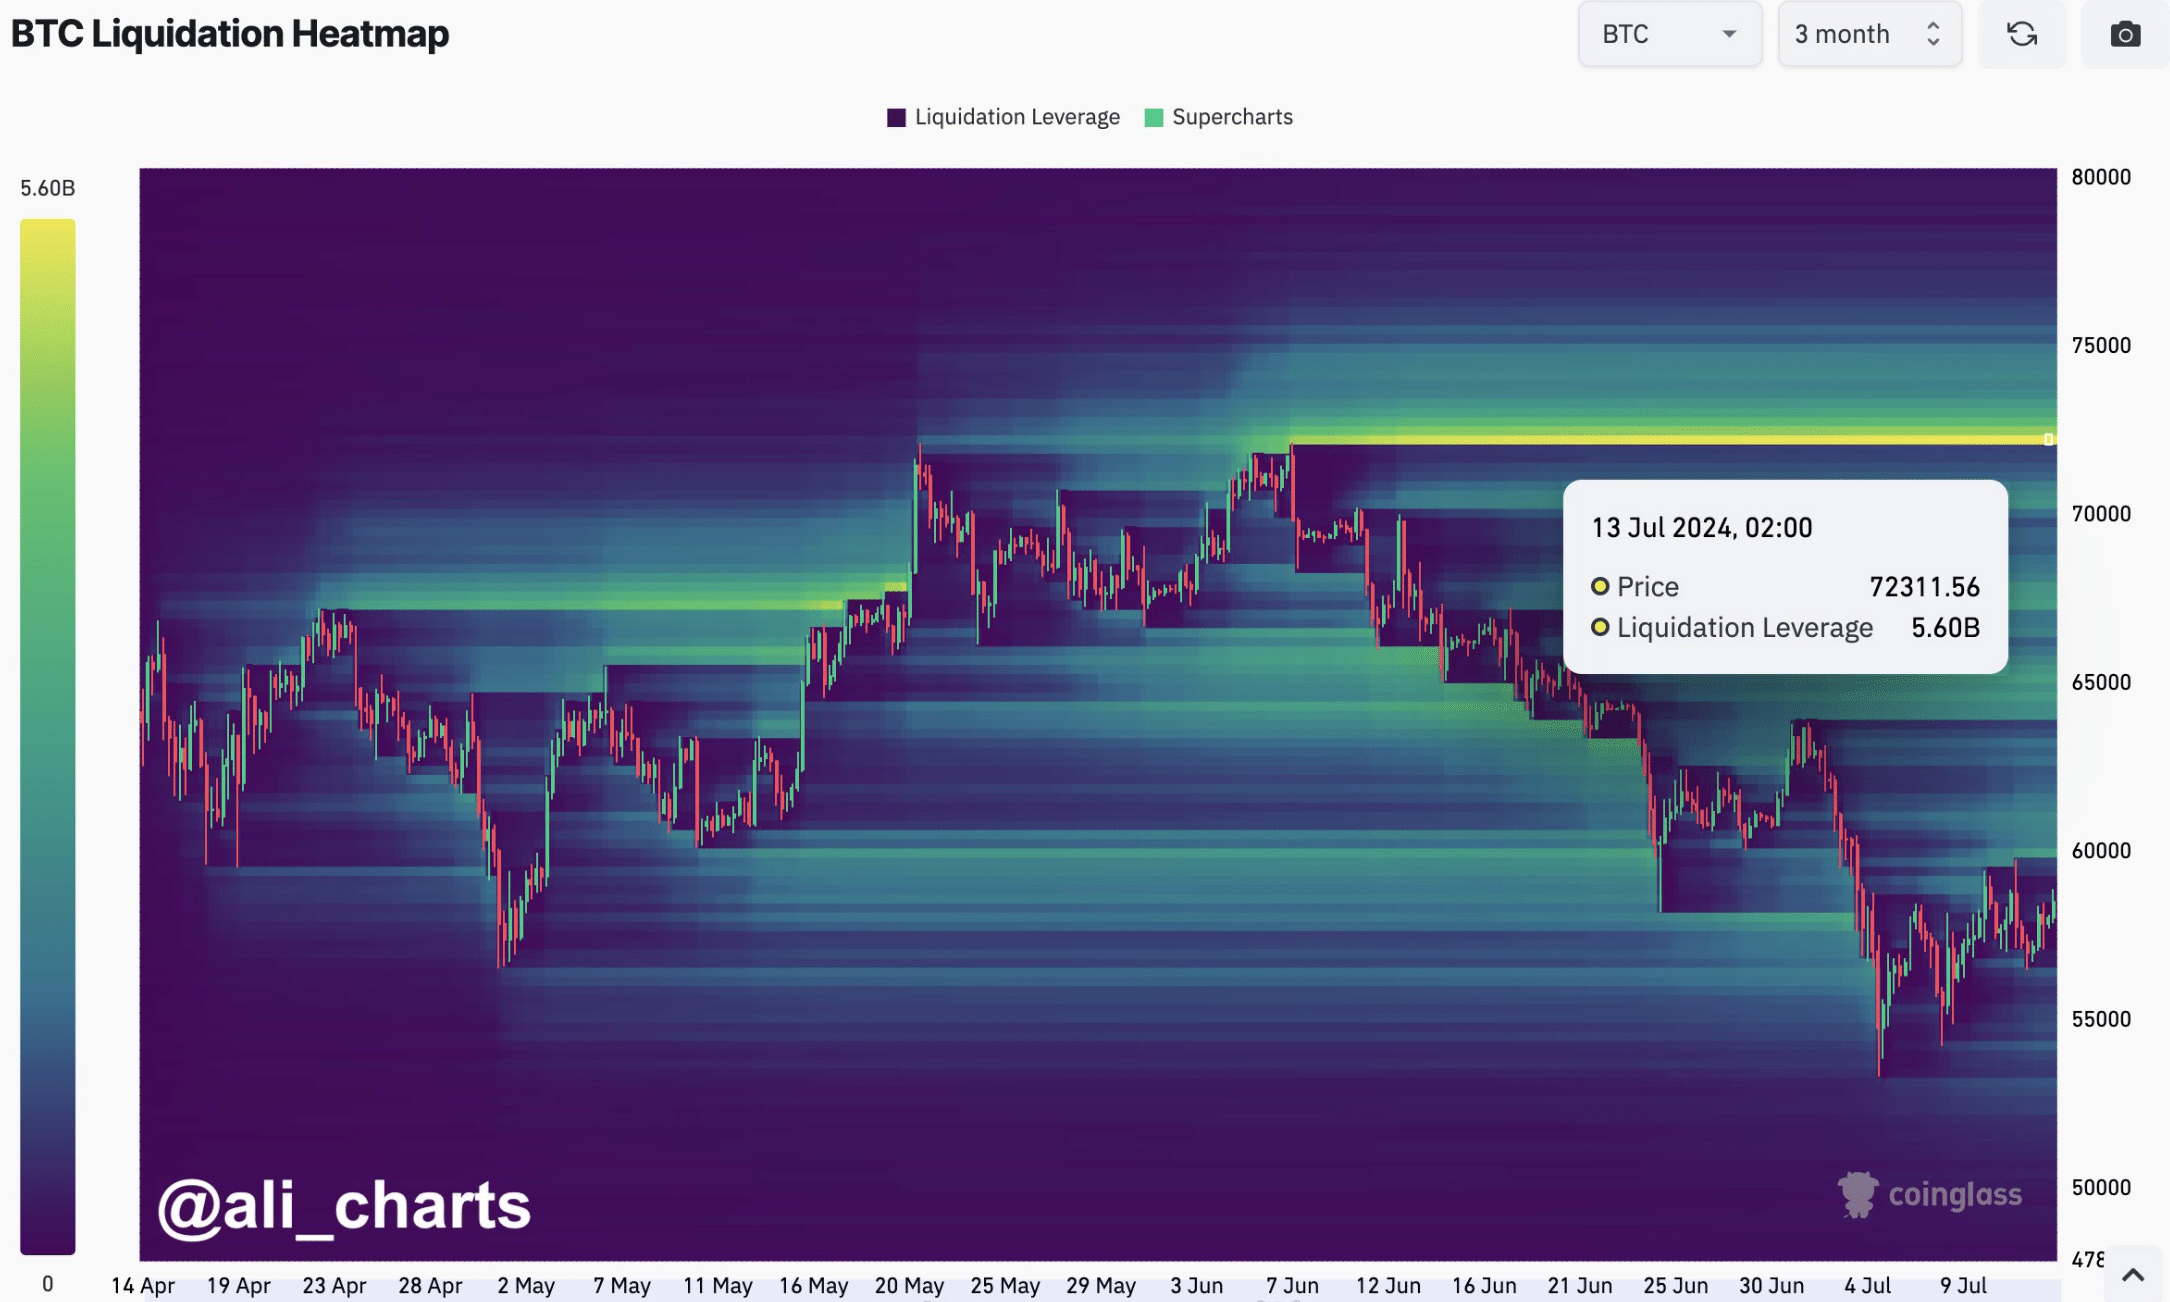
Meanwhile, Ali, a popular crypto analyst, posted a tweet highlighting an important development. As per the tweet, $5.60 billion in short positions will be liquidated if Bitcoin makes a U-turn to $72,300.
This suggested that the chances of BTC witnessing a price correction after touching $72.3k were high.
Generally, whenever liquidation rises, it causes short-term price corrections. Therefore, investors might witness BTC slowing down or plummeting for a few days after it retests its all-time high in the coming weeks.


Source: X
BTC’s road to $72k
Since there were chances of BTC witnessing a price correction at $72k, AMBCrypto planned to check its metrics to find whether there were any other roadblocks ahead of that mark.
AMBCrypto’s analysis of CryptoQuant’s data revealed that Bitcoin’s exchange reserve has increased, which meant that selling pressure on it was rising.
Its aSORP was red. This clearly suggested that more investors were selling at a profit. In the middle of a bull market, it can indicate a market top.
Additionally, its NULP revealed that investors were in a belief phase where they were currently in a state of high unrealized profits.
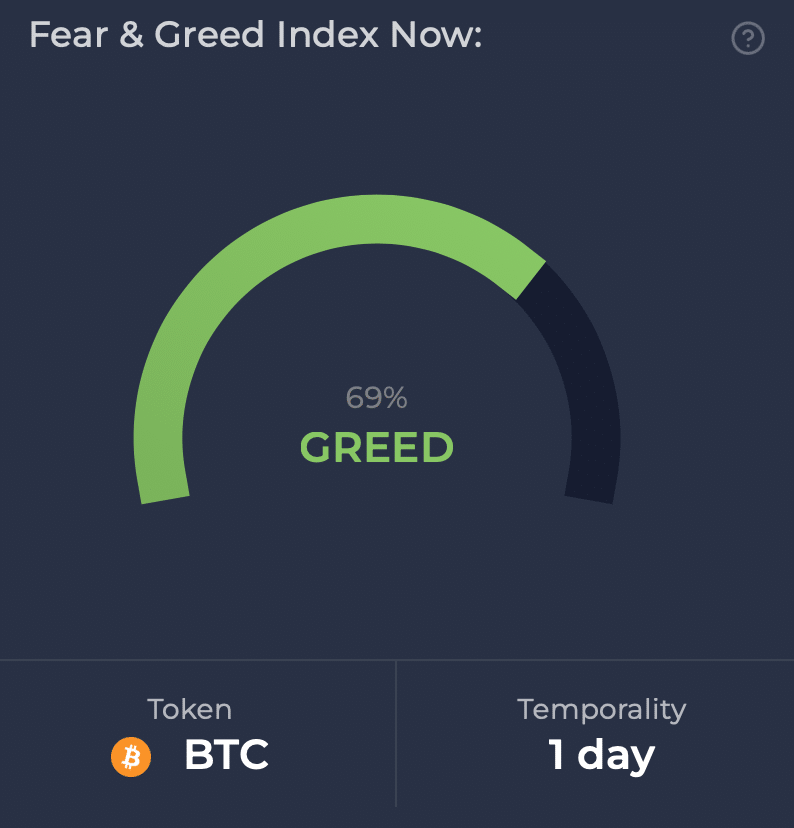
At press time, BTC’s fear and greed index had a reading of 69%, suggesting that the market was in a “fear” phase. Whenever the metric hits that level, it indicates a possible price correction.


Source: CFGI.io
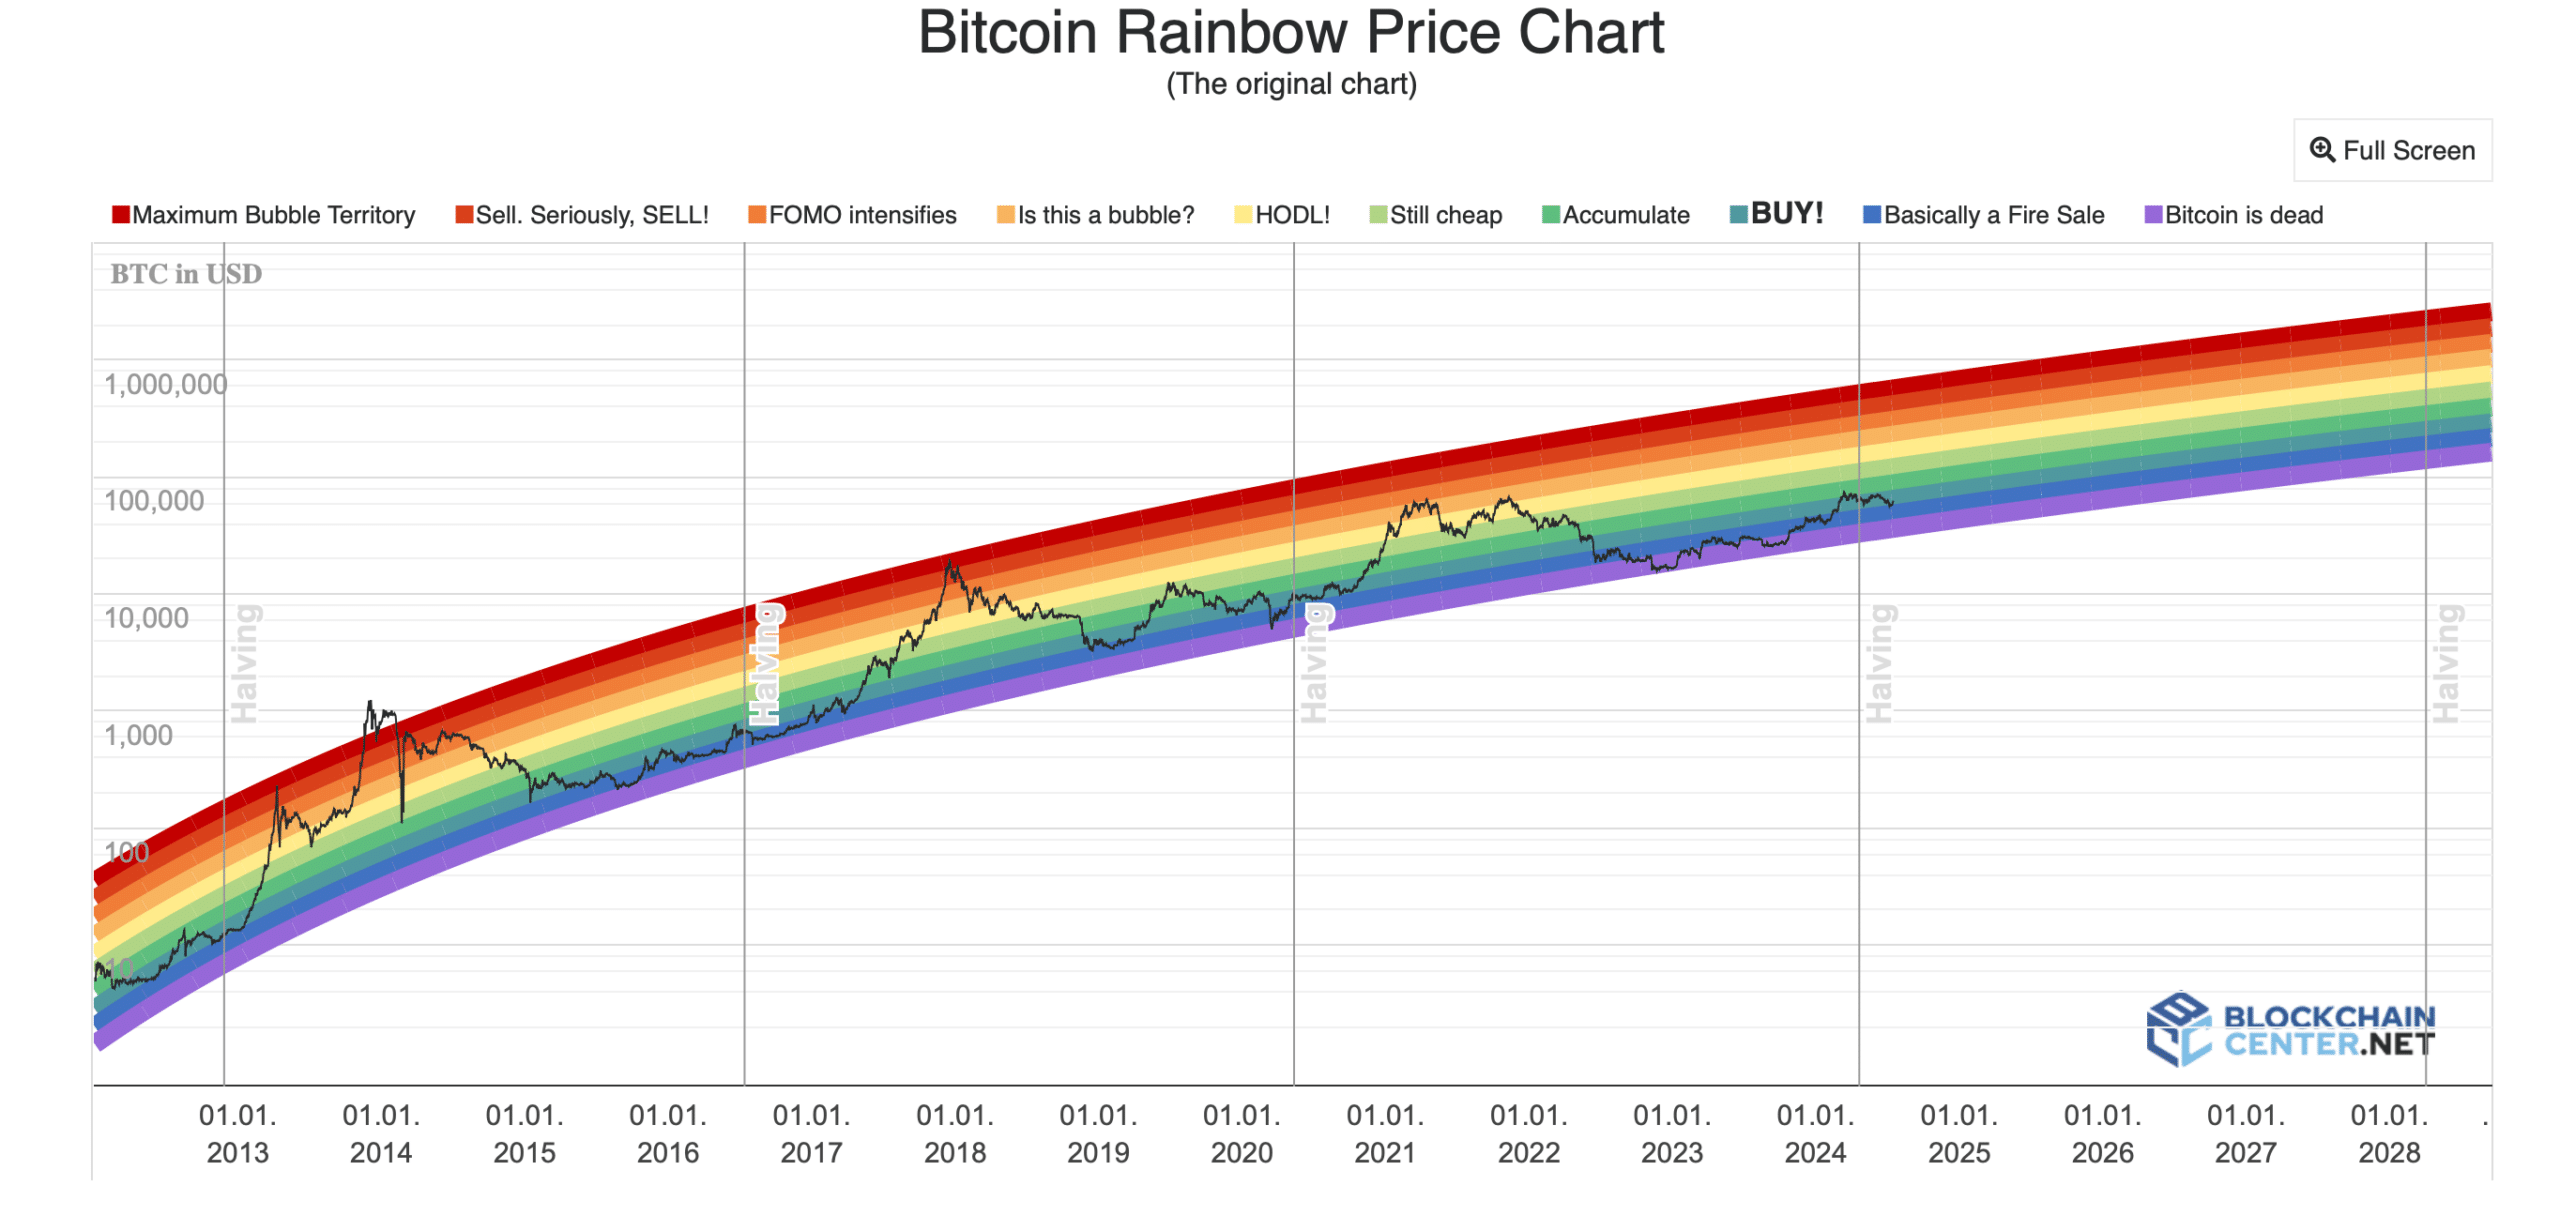
However, Bitcoin’s Rainbow Chart flagged a buy signal. As per the metric, BTC was in the “BUY” phase, meaning that there was still time for investors to accumulate BTC before it reaches new highs.


Source: Blockchaincenter
We then planned to have a look at the coin’s daily chart to better understand whether it was expecting a correction before restarting its journey towards $72k.
Read Bitcoin (BTC) Price Prediction 2024-25
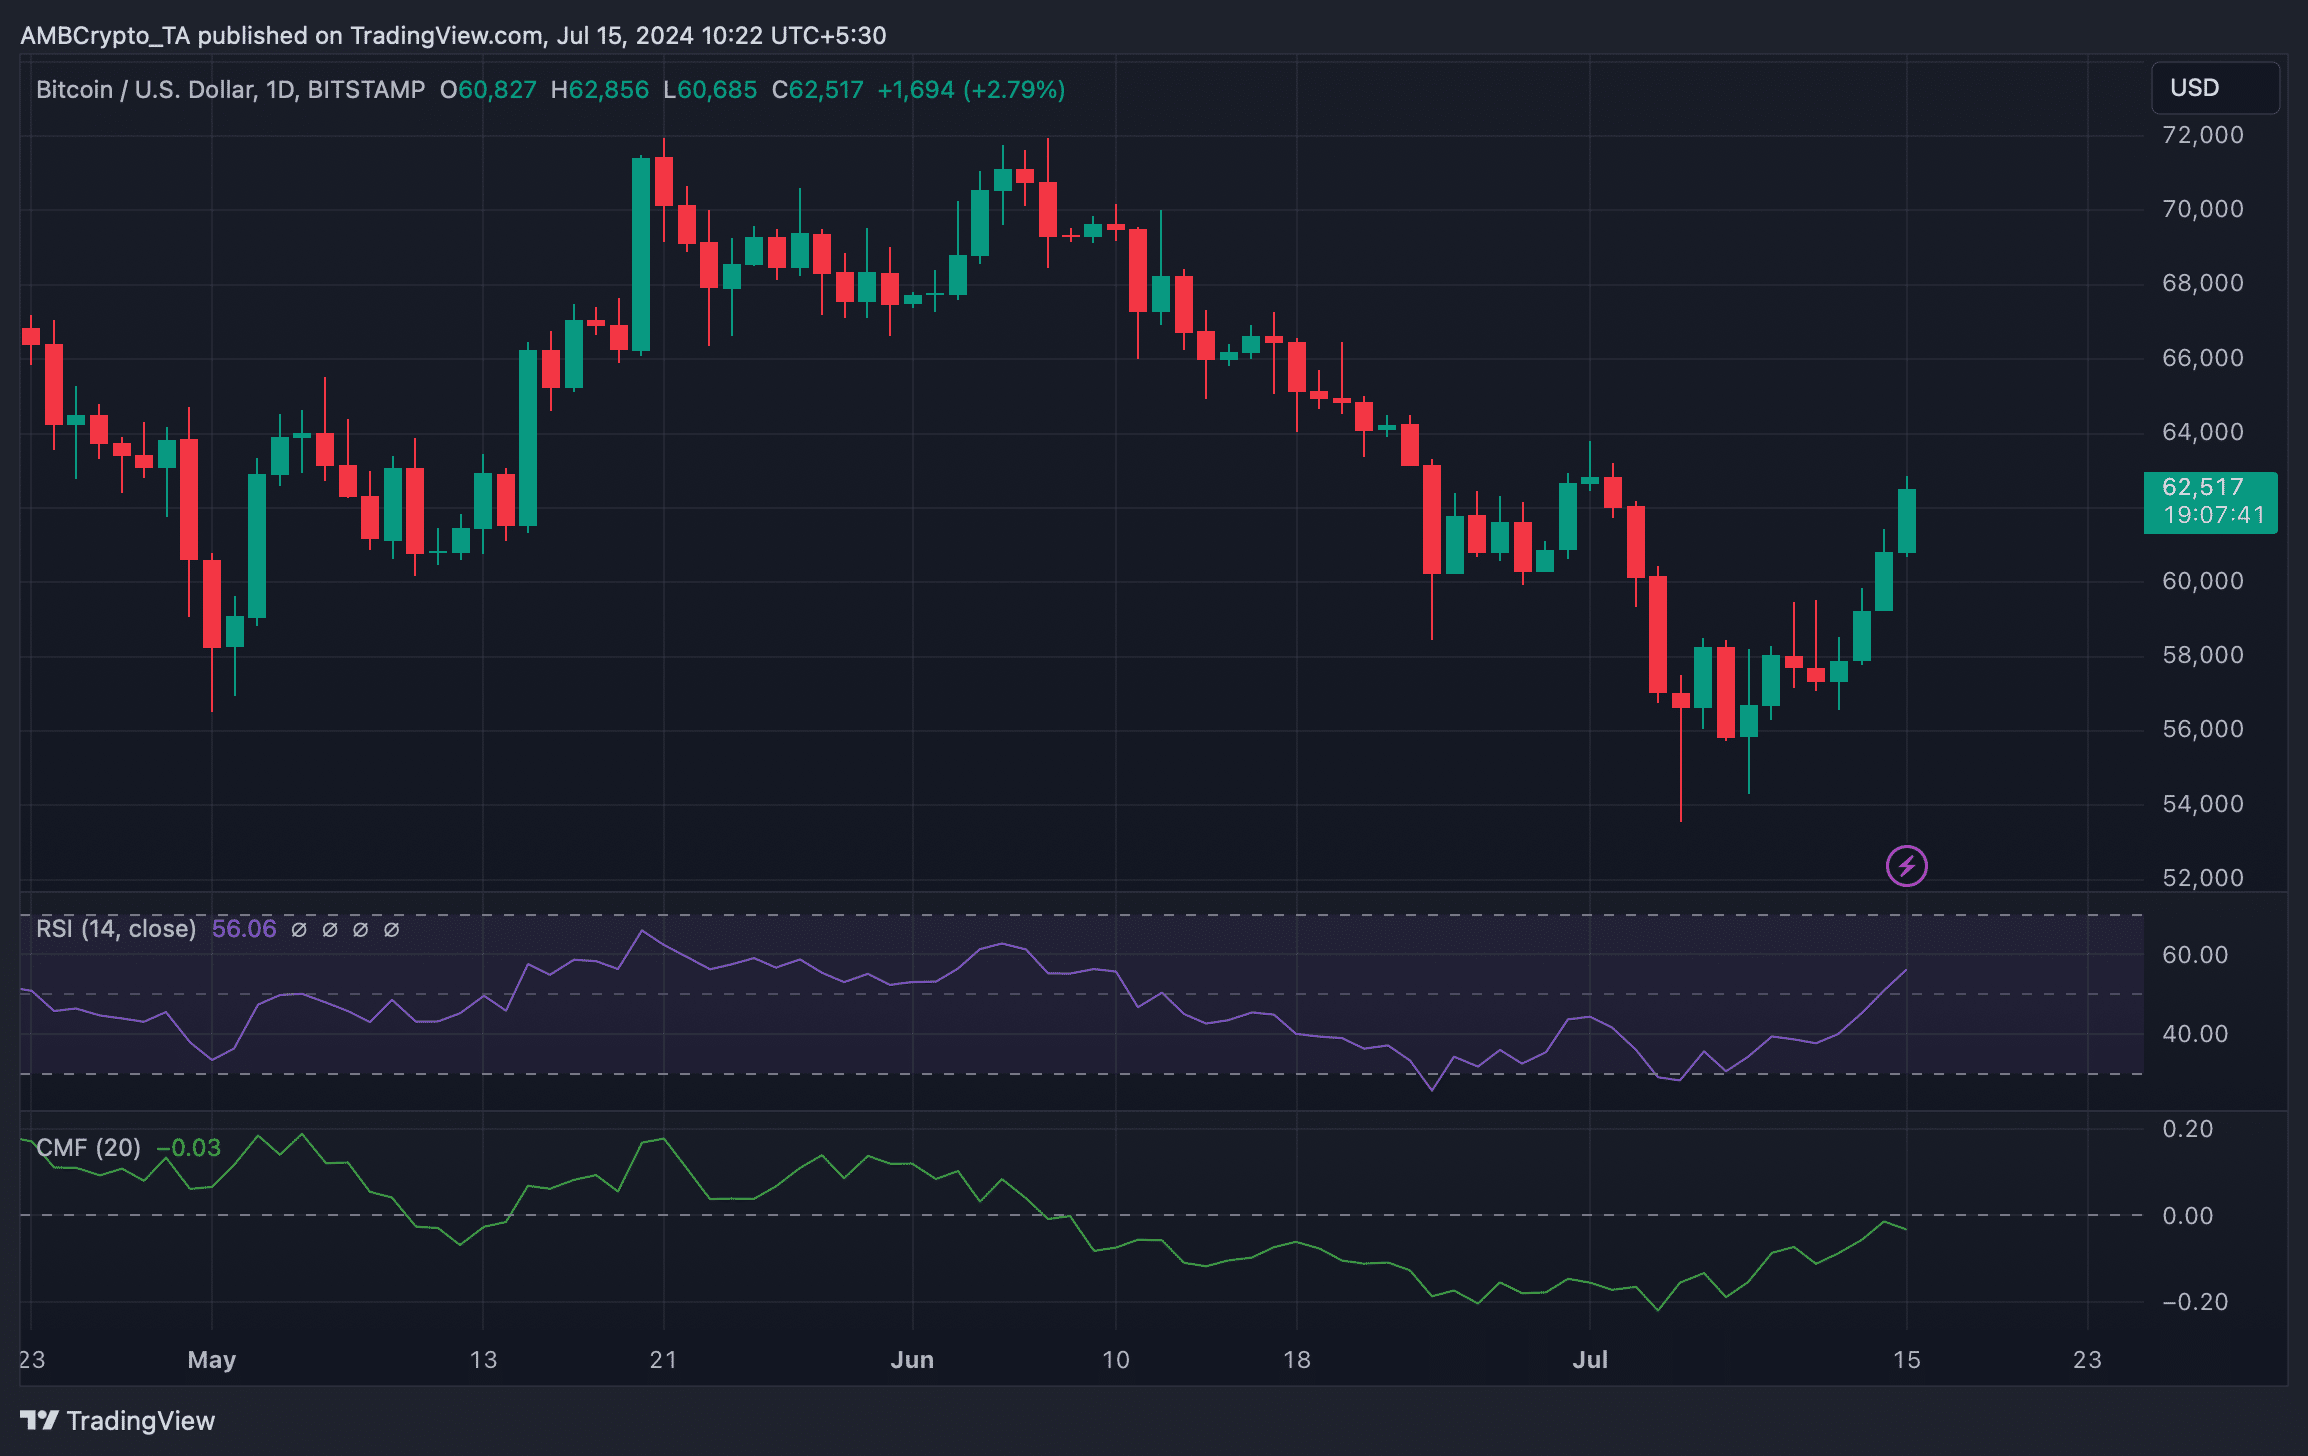
We found that the Chaikin Money Flow (CMF) registered a decline, hinting at a price correction.
Nonetheless, the Relative Strength Index (RSI) remained bullish as it moved further north from the neutral mark.


Source: TradingView


Leave a Reply