

- Bitcoin and Ethereum showcased a bullish market structure on the 12-hour chart.
- Key retracement levels have been defended thus far, but a retest can’t be ruled out yet.
Bitcoin [BTC] and Ethereum [ETH] continued to trade within the short-term range. They have a bullish bias on the higher timeframe price charts, and whales were accumulating both assets at a rapid pace.
A recent AMBCrypto report highlighted that this accumulation could continue for some more time. Bitcoin has high amounts of liquidity close by, which could hinder attempts to break out in either direction.
Bitcoin saw stalled momentum and buying pressure
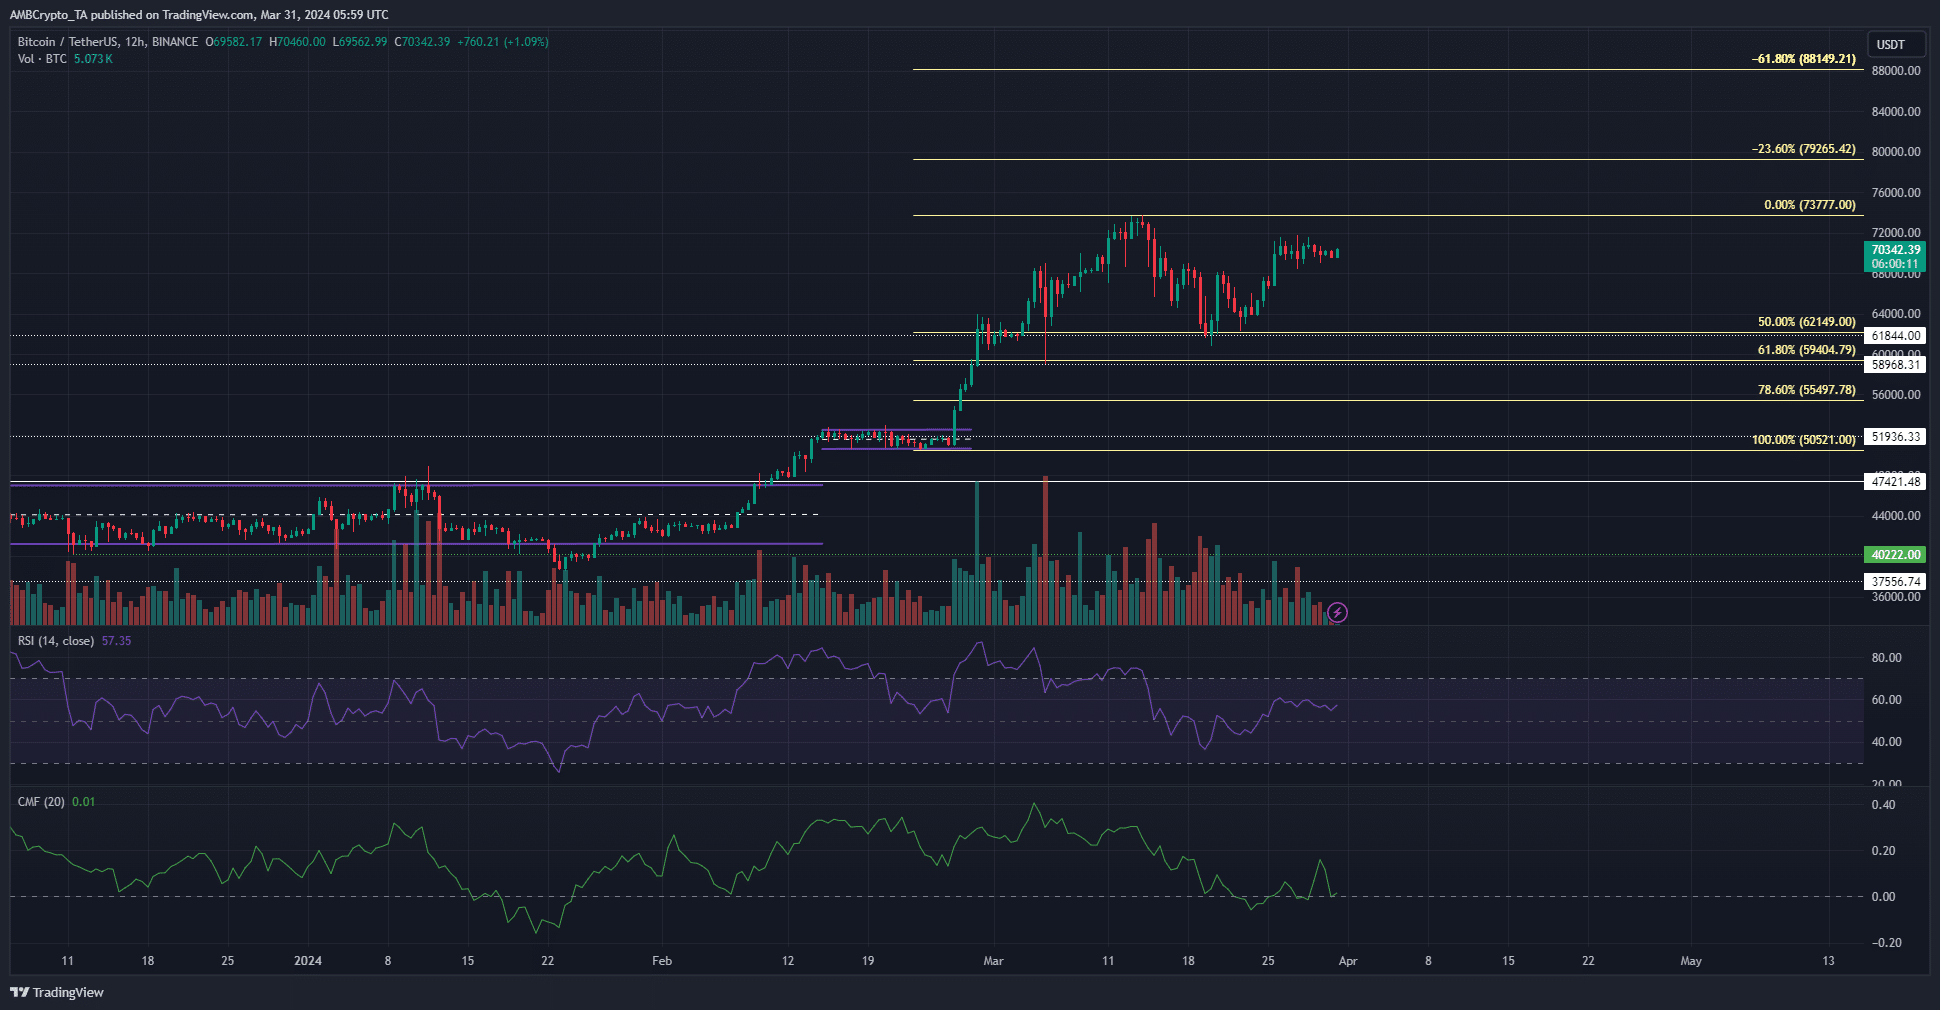
Source: BTC/USDT on TradingView
The Fibonacci retracement levels plotted for the rally from $50.5k to $73.7k showed that the 50% retracement level was tested as support in mid-March.
It saw a decent reaction and Bitcoin was trading at $50k at press time.
Yet, the RSI on the 12-hour chart was only at 57, which signaled bullish momentum but not notable strength.
The Chaikin Money Flow was at +0.01 and would need to climb above +0.05 to show significant capital inflow.
The market structure on the 12-hour chart was bullish. A BTC that falls below $60.7 would flip the market structure bearishly.
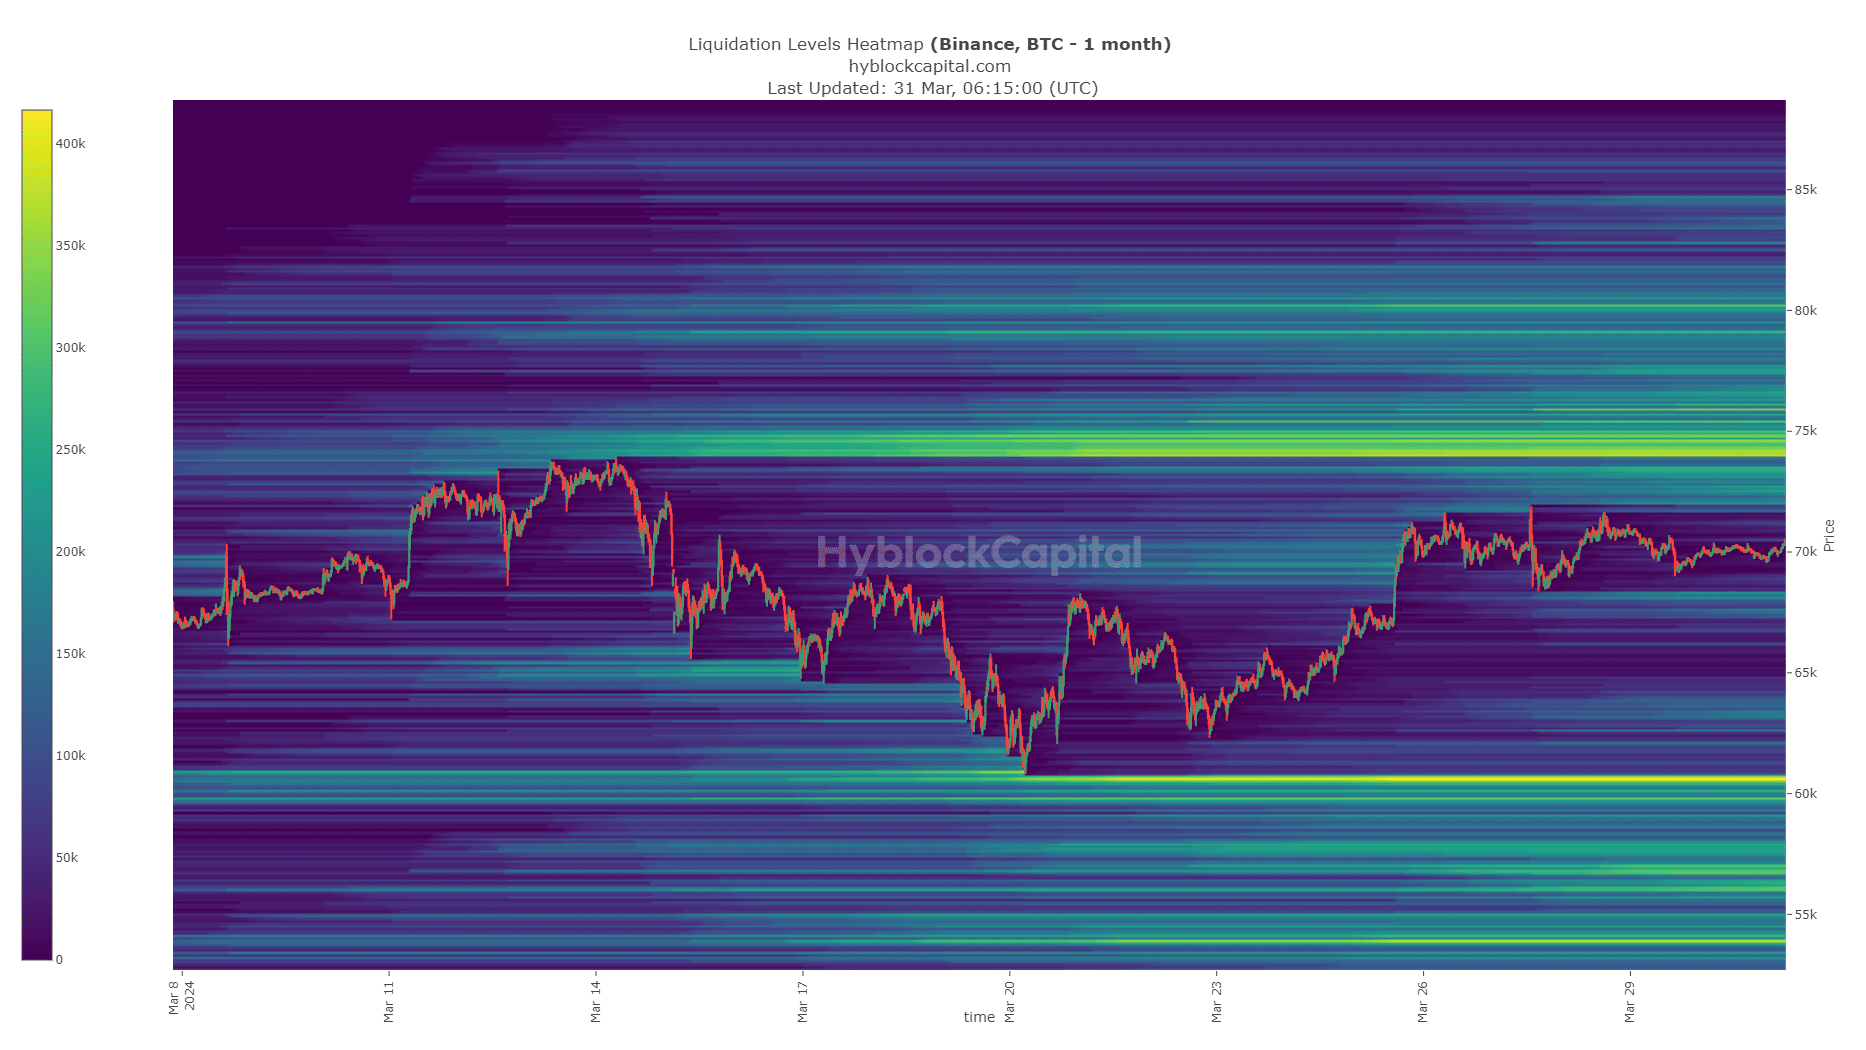
The liquidation levels heatmap showed a significant concentration in the $74k-$74.8k zone. To the south, the $60k-$60.7k also has an intense number of liquidation levels.
Closer to current prices, the band of liquidity at $68.2k was also expected to play a role.
A move above $72k is a cause for celebration for Bitcoin bulls, but expect multiple tries before prices break past the $75k region.
Ethereum climbs to the LTF resistance — will it break out soon?
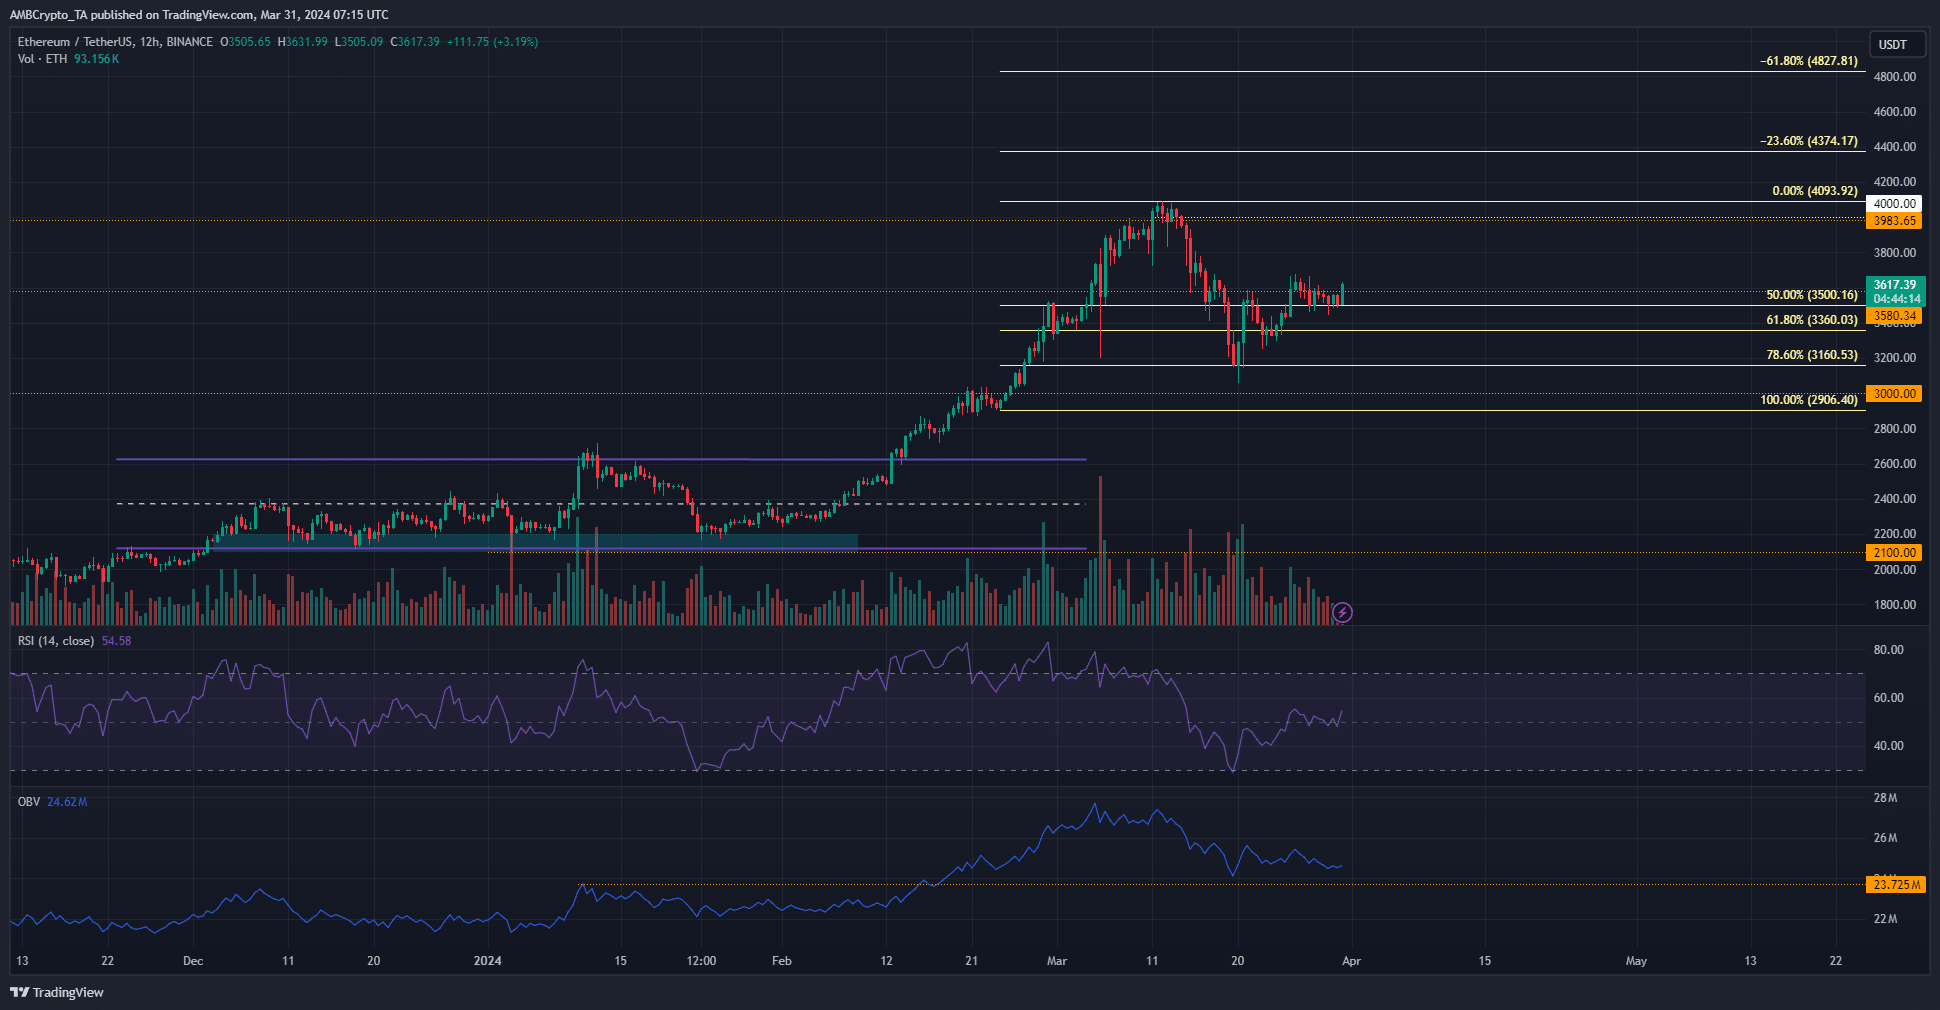
Source: ETH/USDT on TradingView
Ethereum also saw its momentum stall out over the past two weeks. Its 12-hour RSI showed a reading of 54, which signaled bullishness.
Its market structure was also bullish, and the 78.6% retracement level saw a good reaction from the buyers.
However, despite the buying volume in the past ten days, the OBV could not embark on an uptrend. It has sunk almost as low as the January highs, even though the price of ETH is close to 40% higher.
This lack of demand meant Ethereum bulls could take time to catch their breath before attempting the next rally. At press time, it faced some short-term resistance at $3680.
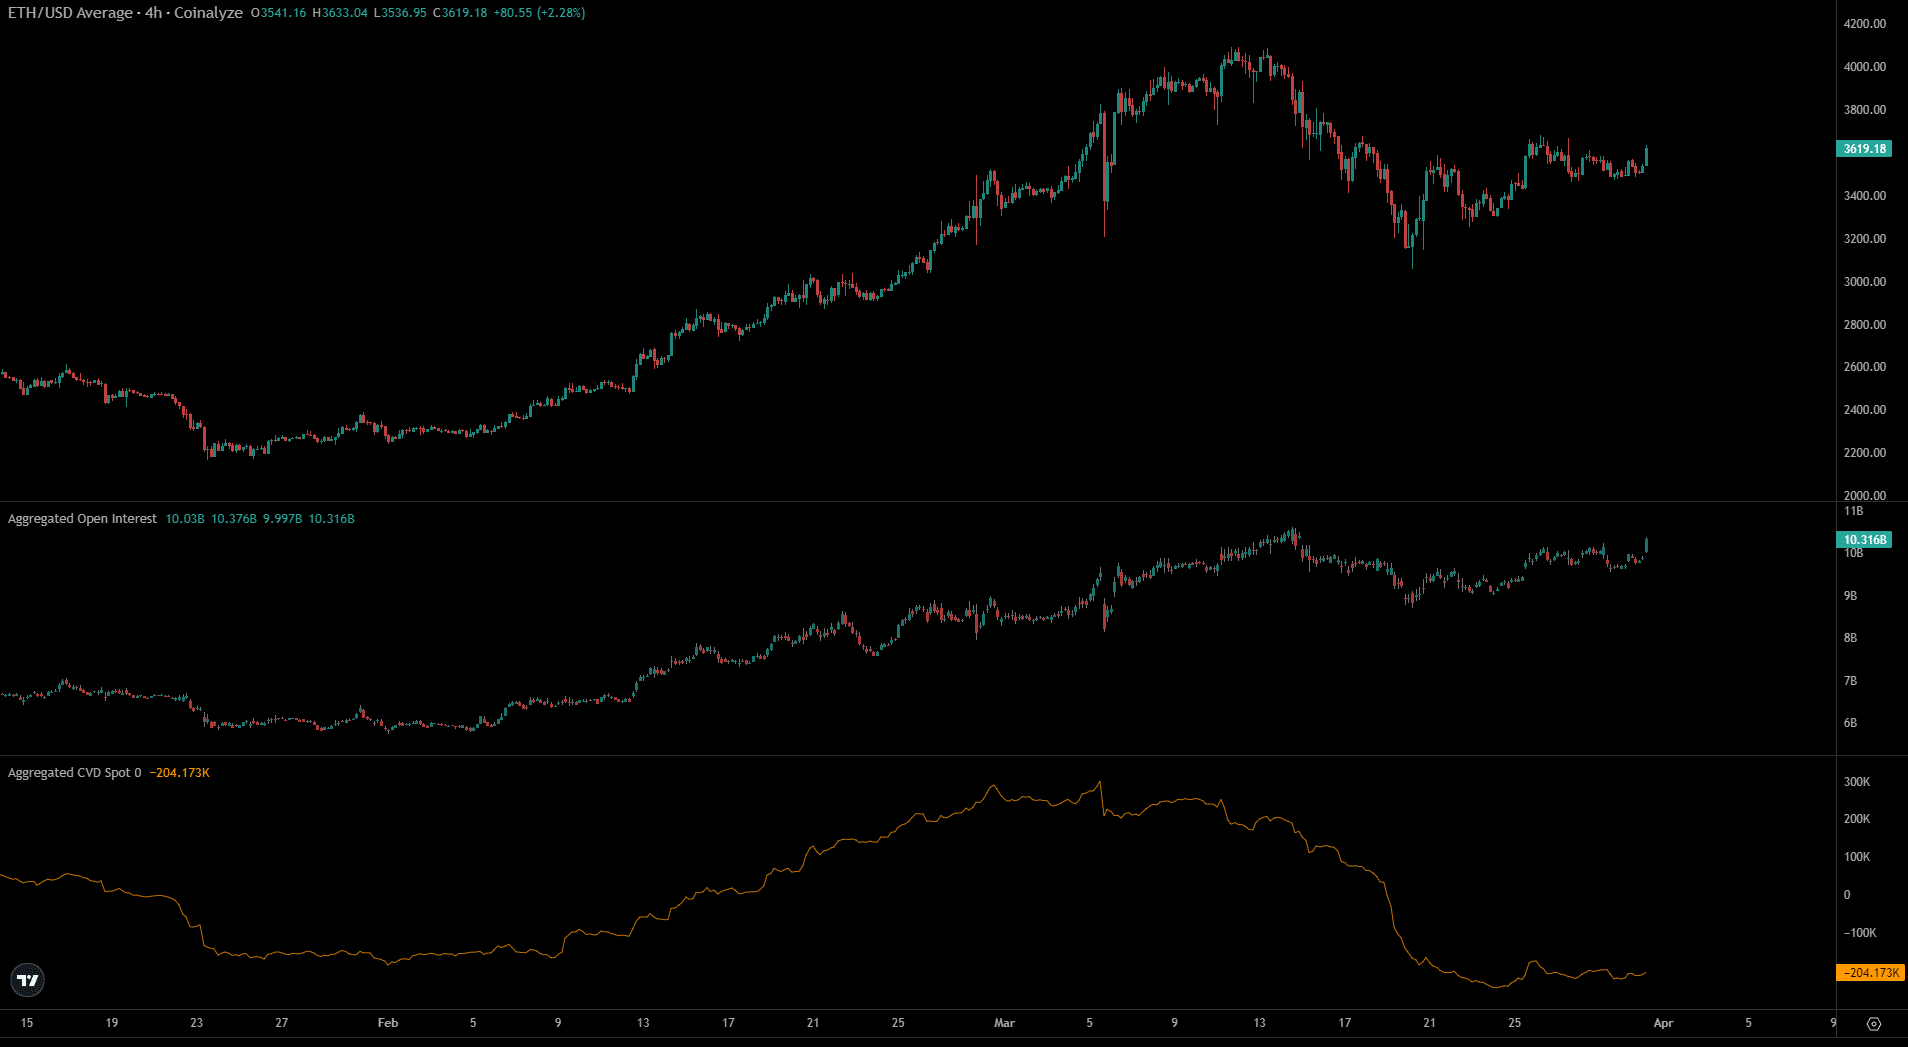
Coinalyze metrics noted the steep selling pressure in the spot markets in March. The spot CVD trended downward this month and only recently flattened out from the southward spiral.
Is your portfolio green? Check out the BTC Profit Calculator
The Open Interest has climbed considerably from the 17th of March. It has risen from $9 billion to $10.31 billion, while Ethereum jumped from $3.2k to $3.6k.
This outlined some bullish conviction amongst speculators in the Futures market.
Disclaimer: The information presented does not constitute financial, investment, trading, or other types of advice and is solely the writer’s opinion.