

- Altcoin dominance has declined by 15% in the last month.
- The demand for ETH remained significantly low, putting the altcoin at risk of a further price decline.
Altcoin dominance has cratered by double digits in the last month. At 9.88% at press time, it has fallen by 15% in the past 30 days, according to TradingView.
Altcoin dominance refers to the relative market share of all cryptocurrencies, excluding Bitcoin [BTC]. Its decline means that the total market capitalization held by altcoins was decreasing compared to BTC.
This may be because investors are moving their funds from altcoins to BTC, which they perceive as a safer and more stable investment asset.
Altcoin dominance waning?
In times of market consolidation like this, altcoin dominance may decline while Bitcoin dominance increases, as altcoins lose value or fail to attract investors.
However, BTC’s dominance has yet to record any significant growth within the one month considered. As of this writing, its value was 55.36%, declining by 1.03% in the last month and 0.69% in the last seven days.
AMBCrypto reported earlier that this gradual decline in BTC dominance is due to the strong resistance the coin faces at the $70,000 price level.
ETH remains at risk of decline
At press time, Ethereum [ETH] traded at $3,561. According to CoinMarketCap, the altcoin’s value has surged by 14% in the past 30 days, despite the general decline in altcoin dominance in the crypto market.
An assessment of the coin’s performance on a daily chart revealed that it broke below the support level of $3693 on 10 June and has since flipped it into resistance.
Even though it has managed a mere 1% price hike in the last week, ETH’s price has since oscillated within a range, with new resistance formed at the $3693 price level and support found at $3428.
Confirming the general decline for ETH among market participants, its key momentum indicators were positioned below their respective center lines at the time of writing.
For example, ETH’s Relative Strength Index (RSI) was 48.60, while its Money Flow Index (MFI) was 29.59.
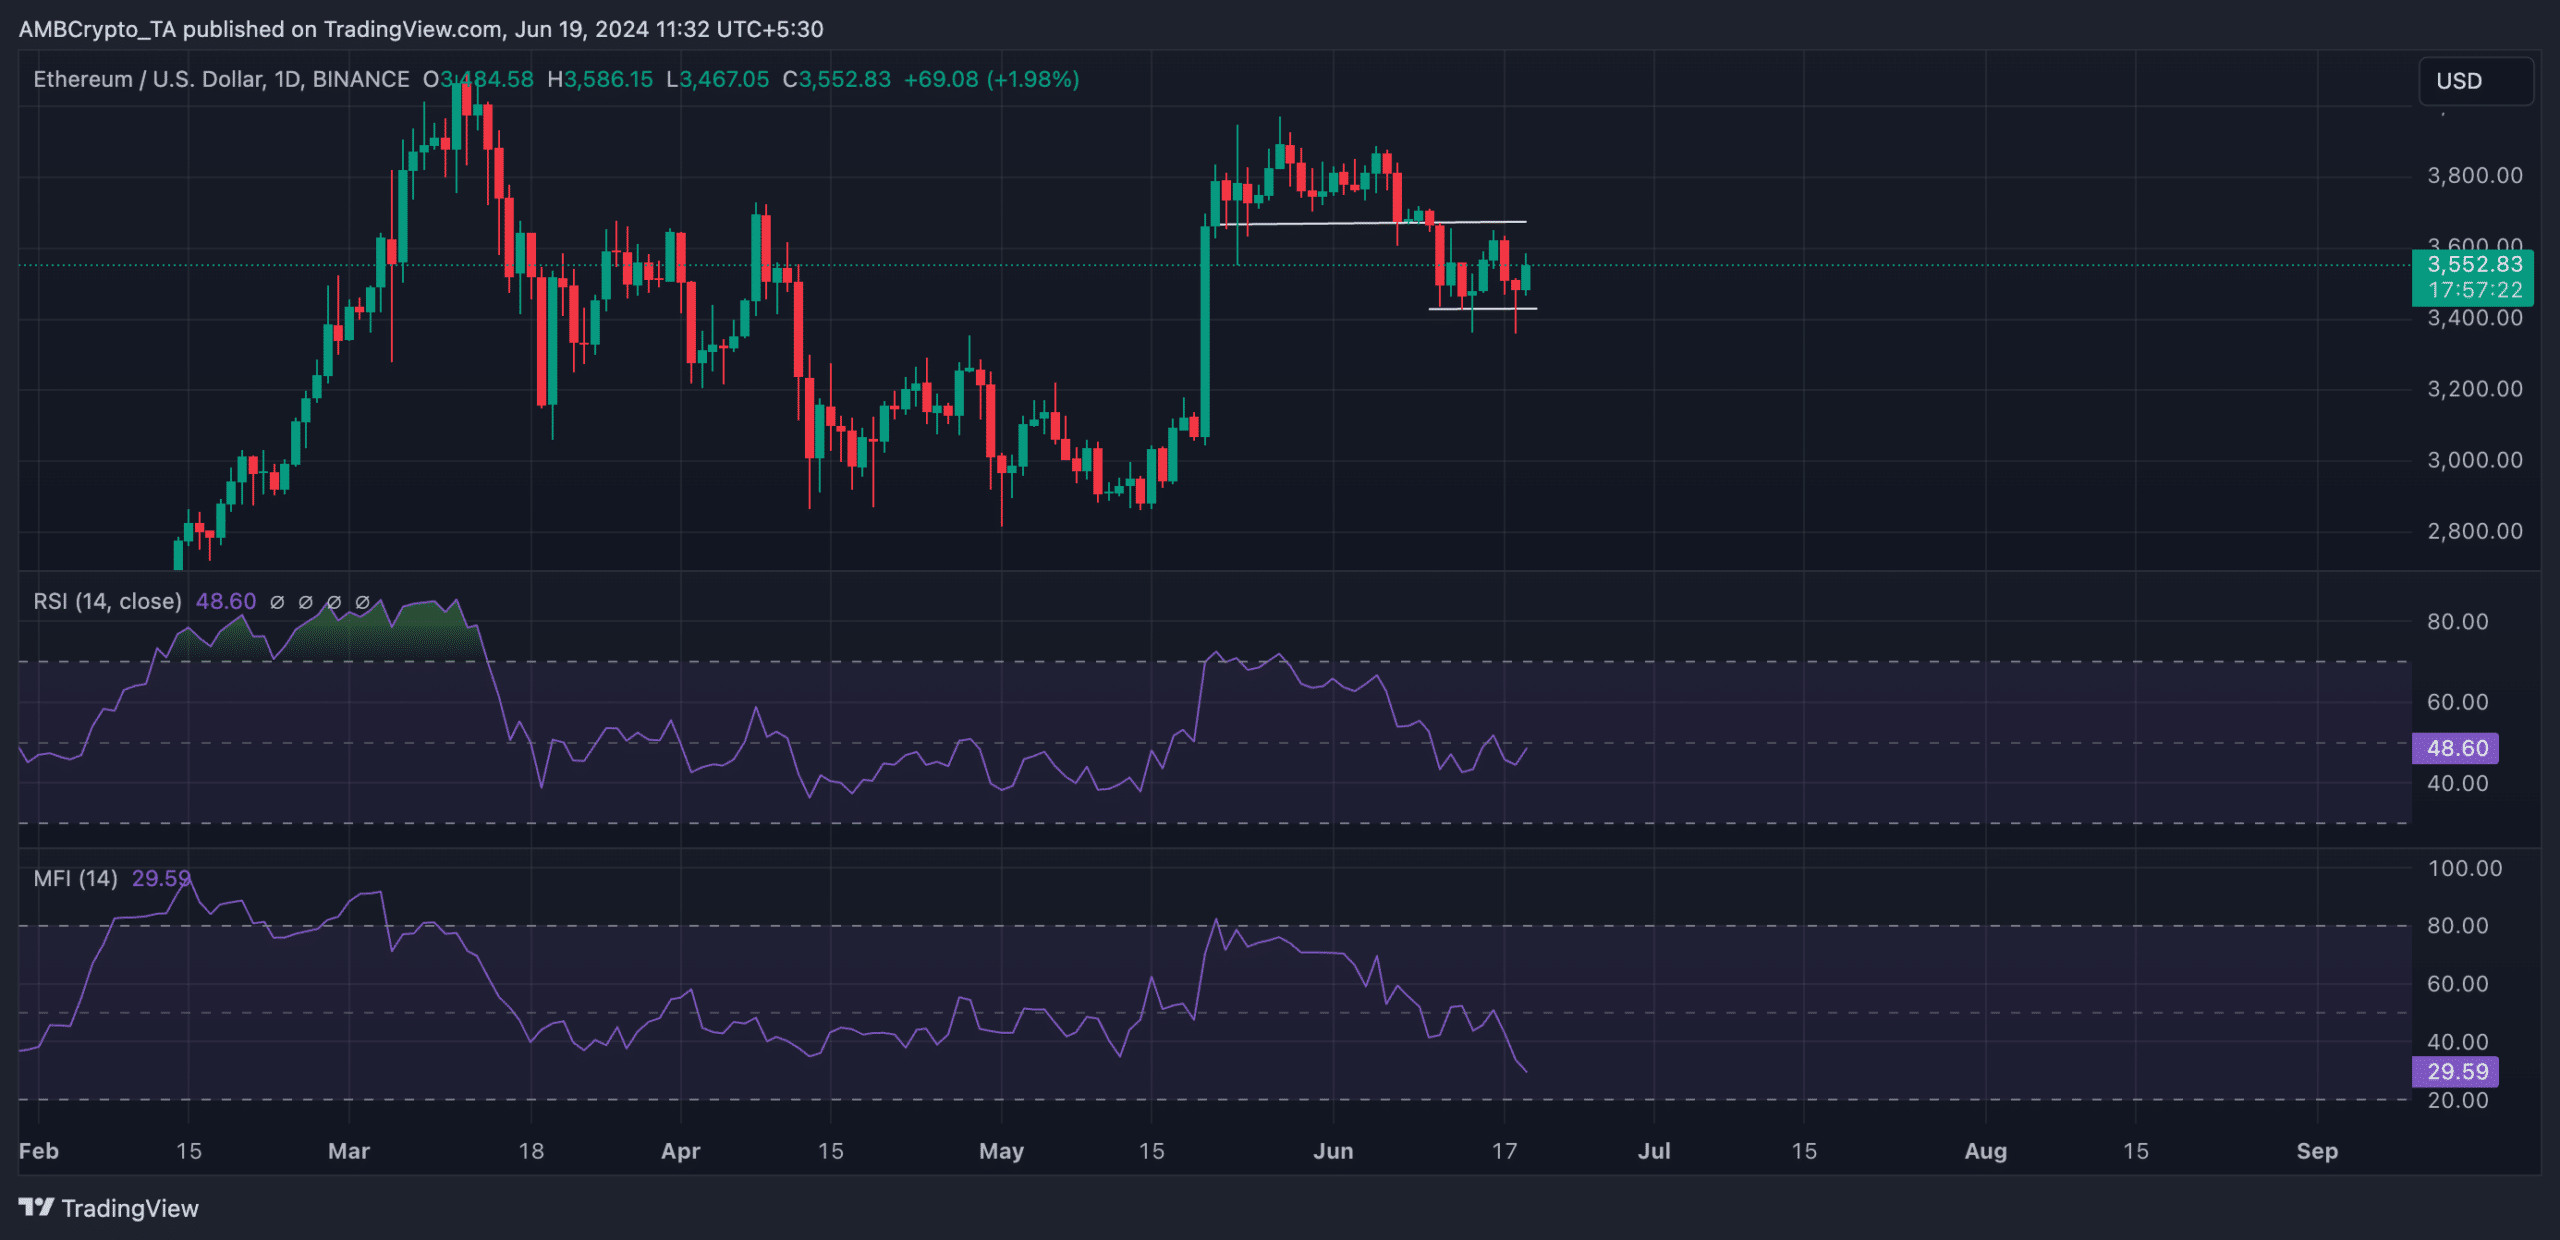
Source: TradingView
These indicators measure oversold and overbought market conditions by tracking an asset’s price changes.
At their values as of this writing, they suggested that selling pressure was significantly higher than buying activity.
Read Ethereum’s [ETH] Price Prediction 2024-2025
If the decline continues, ETH risks falling to $3496.
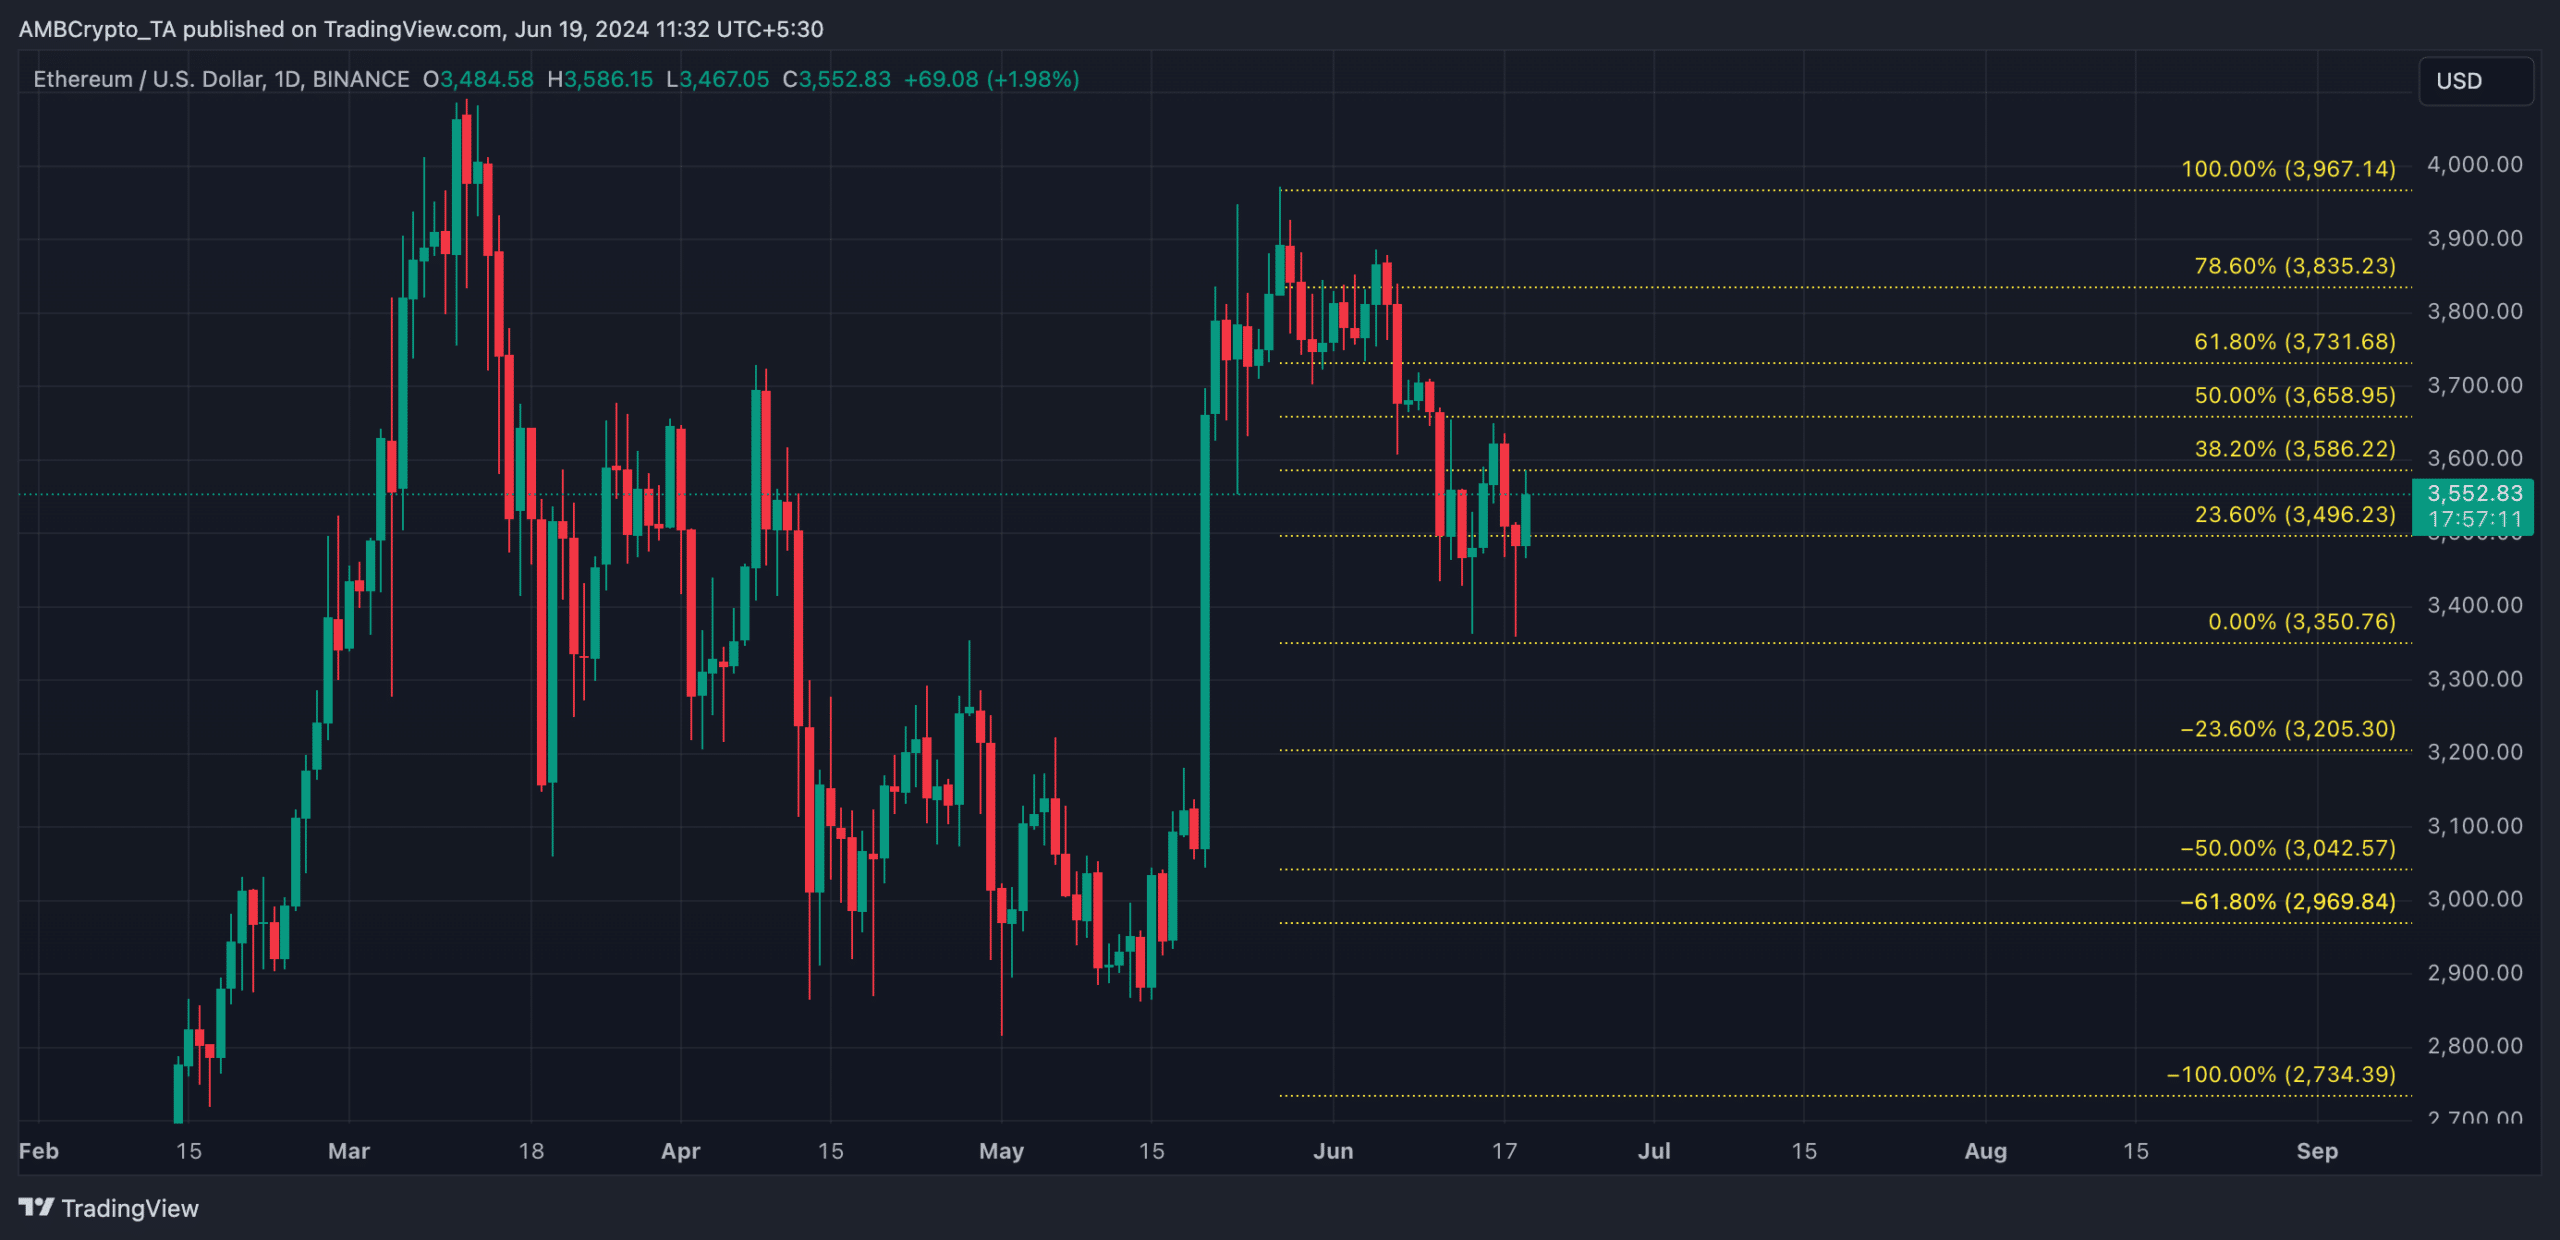
Source: TradingView
However, if invalidated, its price might rally toward $3658.