

- BTC’s dominance has fallen steadily over the past few weeks.
- This is due to its price consolidating within a range.
The resistance faced by Bitcoin [BTC] at the $70,000 price level has led to a steady decline in its market dominance.
BTC dominance refers to the coin’s market capitalization compared to the total market capitalization of all cryptocurrencies. Simply put, it tracks BTC’s share of the entire crypto market.
As of this writing, this was 56.27%, per TradingView’s data.
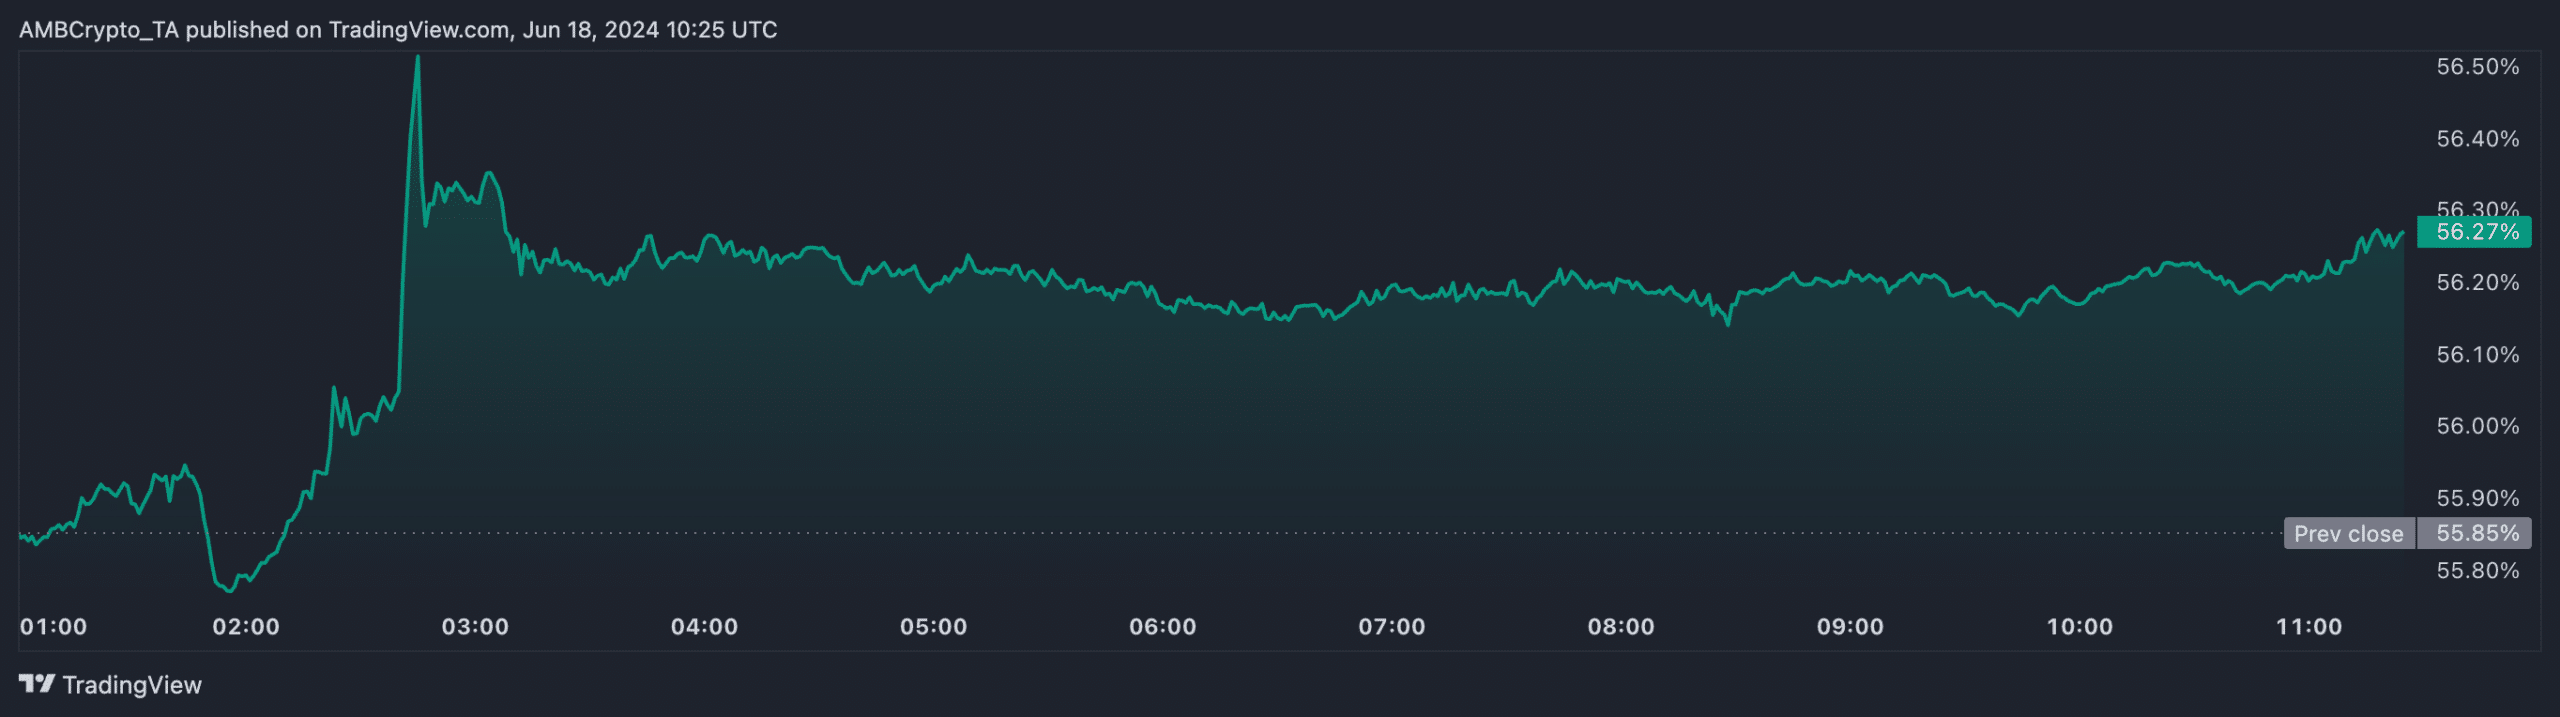
Source: TradingView
Era of the altcoins!
Generally, when BTC’s dominance falls, it opens up opportunities for altcoins to gain traction and potentially outperform the leading crypto asset.
In a post on X (formerly Twitter), pseudonymous crypto analyst Jelle noted that BTC’s consolidation within a price range in the past few weeks has led to a decline in its dominance.
However, once the coin successfully breaks out of this range, altcoins might experience a surge in performance.
Another crypto analyst, Decentricstudio, noted that,
“BTC Dominance has been forming a bearish divergence for 8 months.”
Once it begins to decline, it may trigger an alts season when the values of altcoins see significant growth.
Crypto trader Dami-Defi added,
“The best is yet to come for altcoins.”
However, the projected altcoin market rally might not occur in the short term.
According to Dami-Defi, while it is unlikely that BTC’s dominance exceeds 58-60%, the current outlook for altcoins suggested a possible short-term decline.
This implied that the altcoin market might see further dips before a substantial recovery begins.
BTC dominance to shrink more?
At press time, BTC exchanged hands at $65,521. Per CoinMarketCap’s data, the king coin’s value has declined by 3% in the past seven days.
With significant resistance faced at the $70,000 price level, accumulation amongst daily traders has waned. AMBCrypto found BTC’s key momentum indicators below their respective center lines.
For example, the coin’s Relative Strength Index (RSI) was 41.11, while its Money Flow Index (MFI) 30.17.
At these values, these indicators showed that the demand for the leading coin has plummeted, further dragging its price downward.
Readings from BTC’s Parabolic SAR indicator confirmed the ongoing price decline. At press time, it rested above the coin’s price, and they have been so positioned since the 10th of June.

Source: BTC/USDT, TradingView
The Parabolic SAR indicator is used to identify potential trend direction and reversals. When its dotted lines are placed above an asset’s price, the market is said to be in a decline.
Read Bitcoin (BTC) Price Prediction 2024-2025
It indicates that the asset’s price has been falling and may continue to do so.

Source: BTC/USDT, TradingView
If this happens, the coin’s price may fall to $64,757.