- High liquidity at $0.73 could stop the price from appreciating further.
- The token’s next target could be $0.85 if bulls can clear the hurdle.
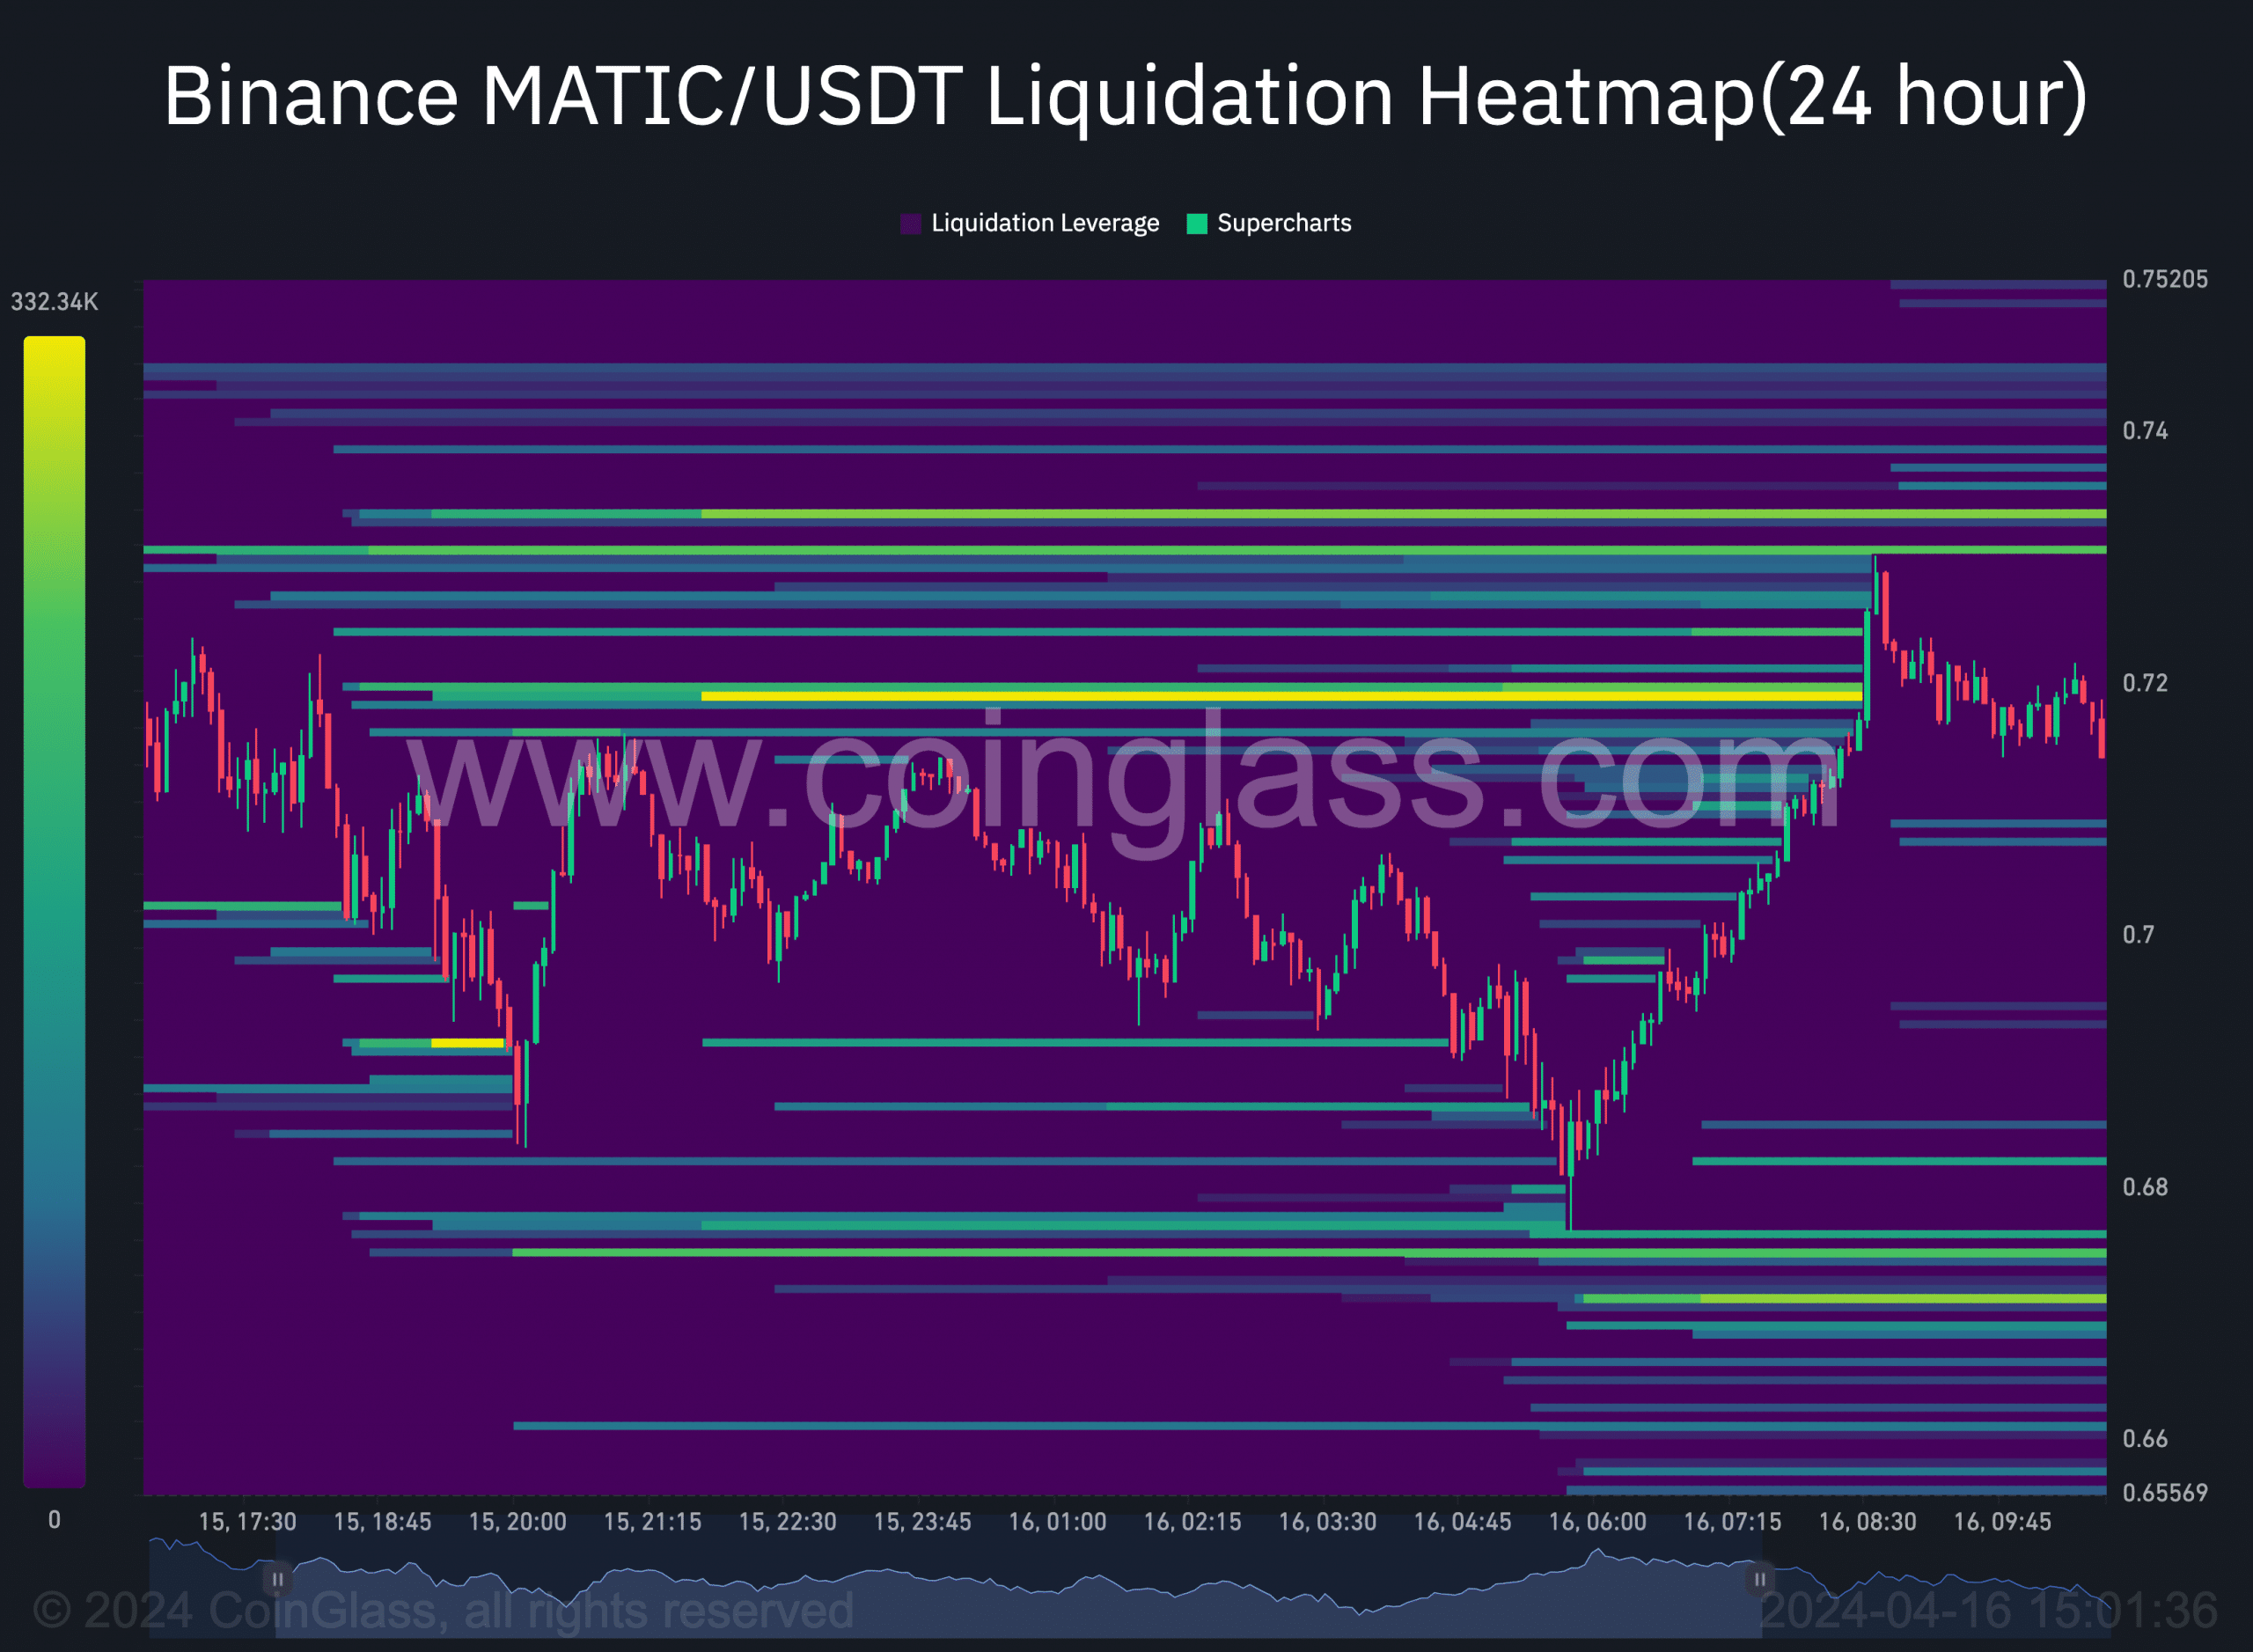
Polygon [MATIC] might have shown signs of seller exhaustion but surpassing $0.73 might be implausible in the short term. This was the signal AMBCrypto got after checking the liquidation heatmap.
Colors on the heatmap range from purple to yellow. Purples represent a low number of predicted liquidations. Yellow indicates high liquidation levels.
According to data analyzed from Coinglass, there was a high level of liquidity around $0.73. At this level, open positions valued at $235,280 could be wiped out.


Source: Coinglass
Will MATIC escape?
But that wasn’t the only thing. The same zone might serve as resistance for the token. Therefore, if MATIC appreciates, a close above $0.73 could be a hard nut to crack.
At press time, the Polygon native token changed hands at $0.68. This value was a 25.56% correction in the last seven days.
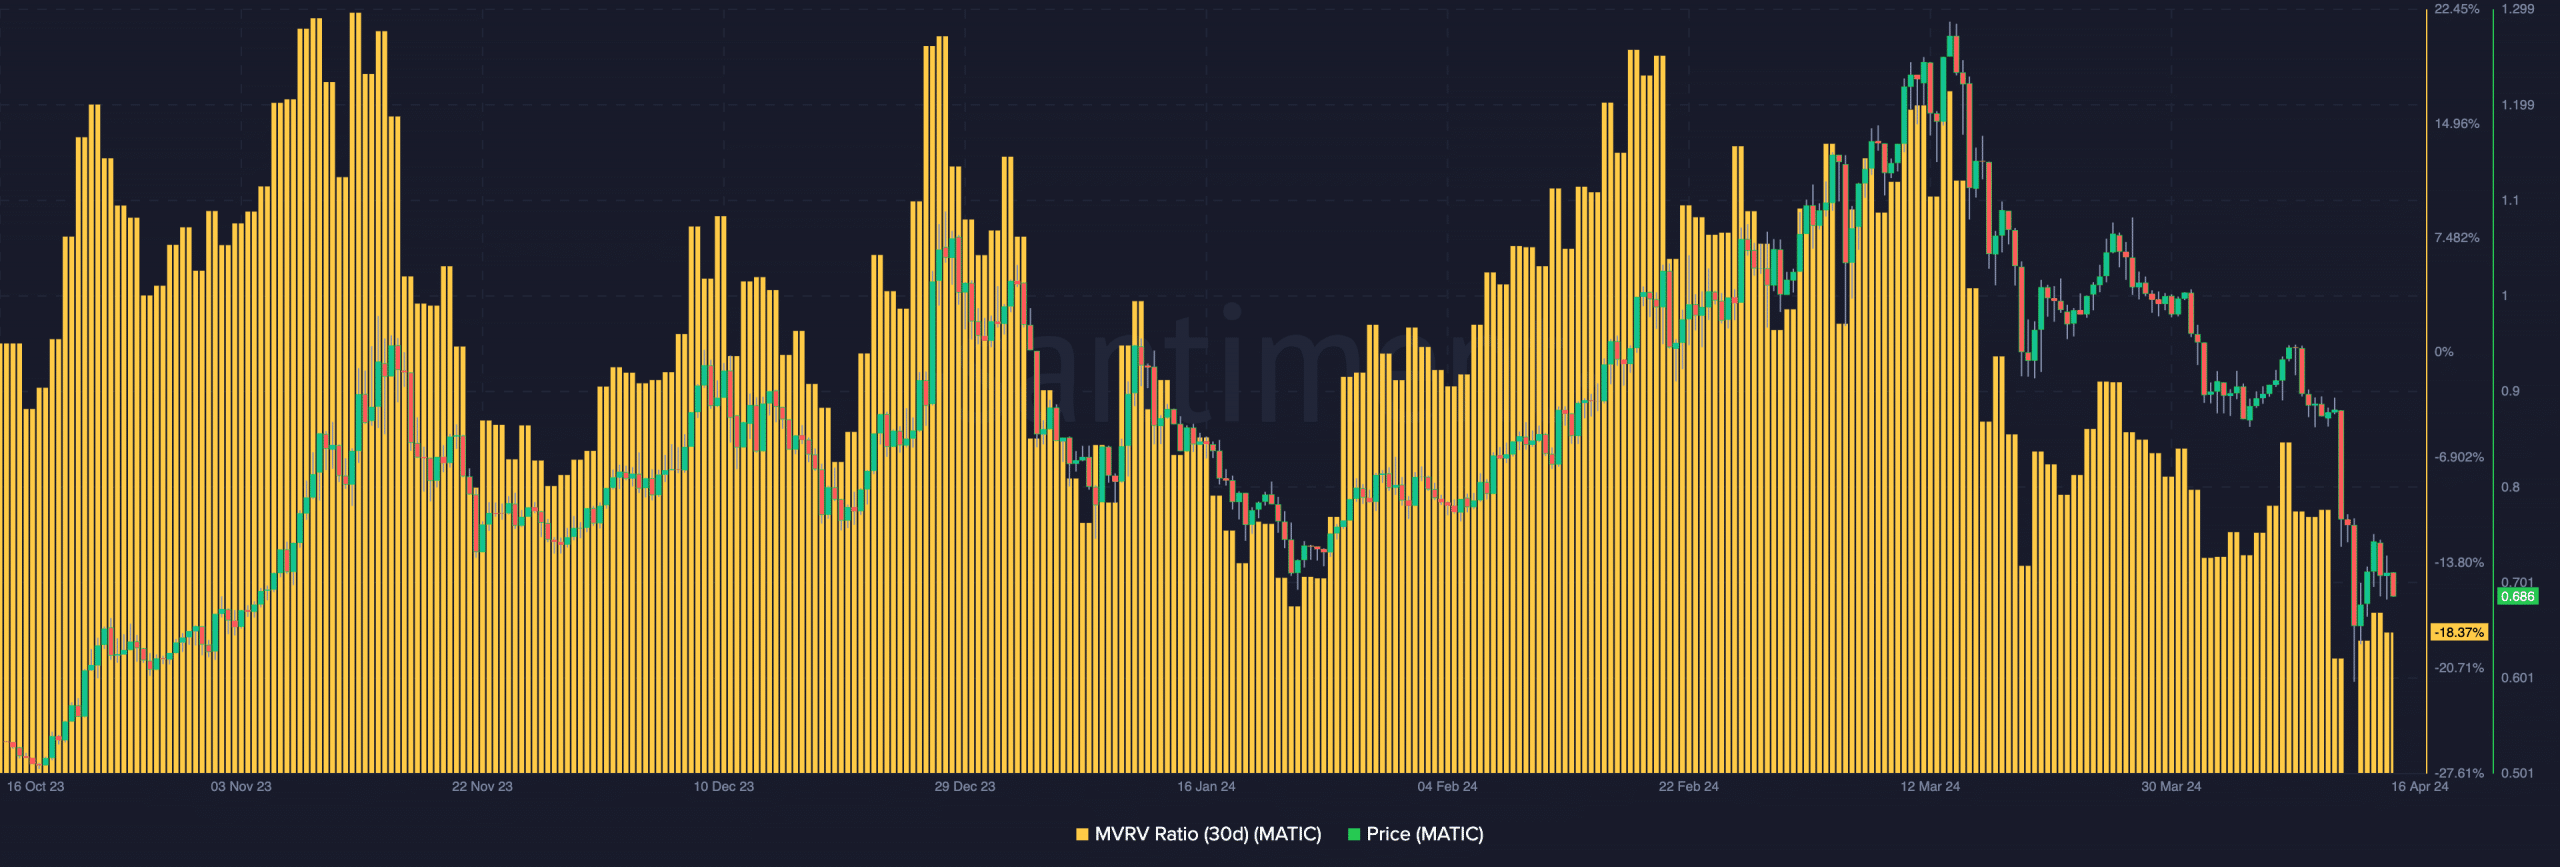
However, the Market Value to Realized Value (MVRV) ratio indicated a possible rebound for MATIC.
As of this writing, the 30-day MVRV ratio was -18.37%. This reading implied that most holders of the token will be realizing losses if they sell at the current price.
On the other side of the spectrum, the MVRV ratio indicated that MATIC was undervalued. In recent times, when Polygon hits this region, a bounce happens.
Should buying pressure appear at this point, the price could surpass $0.70 in the short term.
As mentioned earlier, the token might face resistance at $0.73. However, if bulls intensify dominance, the resistance could be clear, and Polygon’s next target could be around $0.85.


Source: Santiment
Besides the on-chain perspective, it is important to view the price potential from a technical lens. This was what AMBCrypto did.
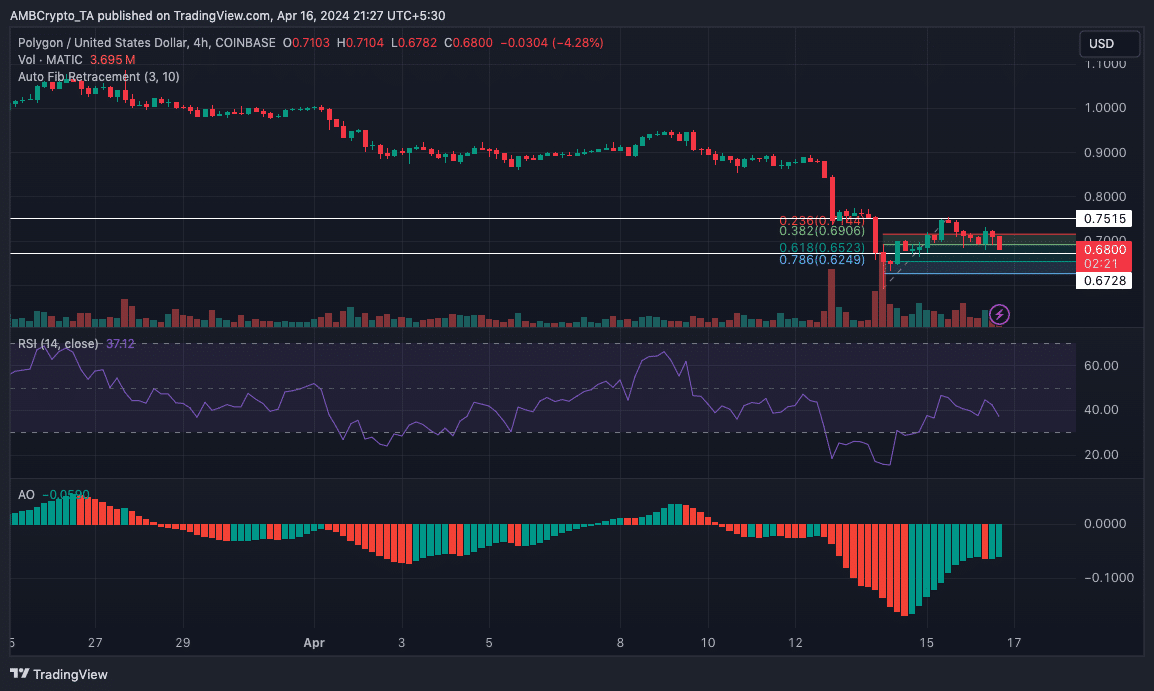
According to the 4-hour chart, MATIC had attempted to flip $0.75 on the 13th of April. But the token was forced back. A similar attempt appeared on the 15th but bears ensured that the token did not clear the path.
Price to swing sideways
At press time, bulls had formed support at $0.67. As long as this defense remains there, the value of the token might not drop below the point.
Furthermore, the Relative Strength Index (RSI) turned downwards, indicating a bearish momentum. With the trend displayed, Polygon’s price might not hit $0.70 soon.
However, if the RSI hits the oversold region, the cryptocurrency might recover. For the short-term price targets, the Fibonacci retracement showed that MATIC might swing between $0.62 and $0.67.


Source: TradingView
Read Polygon’s [MATIC] Price Prediction 2024-2025
In addition, the Awesome Oscillator (AO) flashed green histogram bars, suggesting that the increasing downward momentum could be nullified.
If this is the case, the price of MATIC might head in the $0.71 direction where the 0.236 Fibonacci level was positioned.


Leave a Reply