

- Polkadot was down by more than 3% in the last 24 hours.
- Market indicators and derivatives metrics looked bearish.
Polkadot [DOT] fell alongside the rest of the crypto market, as its price dropped 3% in the last 24 hours.
However, before the market condition changed, an analysis revealed that there were chances of DOT touching $14–$15. Let’s take a look at DOT’s current state to see whether that can still be expected.
Polkadot bears are here
FLASH, a popular crypto analyst, recently posted a tweet highlighting that there were chances of DOT hitting $14–$15 in the coming weeks before reaching a market top somewhere in May.
If DOT manages to test its support near $0.92, then things might change in its favor. A successful test of that support could trigger a bull rally, allowing DOT to reach $15.
However, considering the current market scenario, that didn’t seem to be happening for most cryptos. Several top coins, including Ethereum [ETH], witnessed corrections.
According to CoinMarketCap, DOT was trading at $9.27 with a market capitalization of over $13 billion.
The downtrend was accompanied by a 40% rise in trading volume, acting as a foundation for the bear rally.
AMBCrypto’s analysis of Santiment’s data revealed that Polkadot’s Social Volume dropped. However, despite this, its Weighted Sentiment improved.
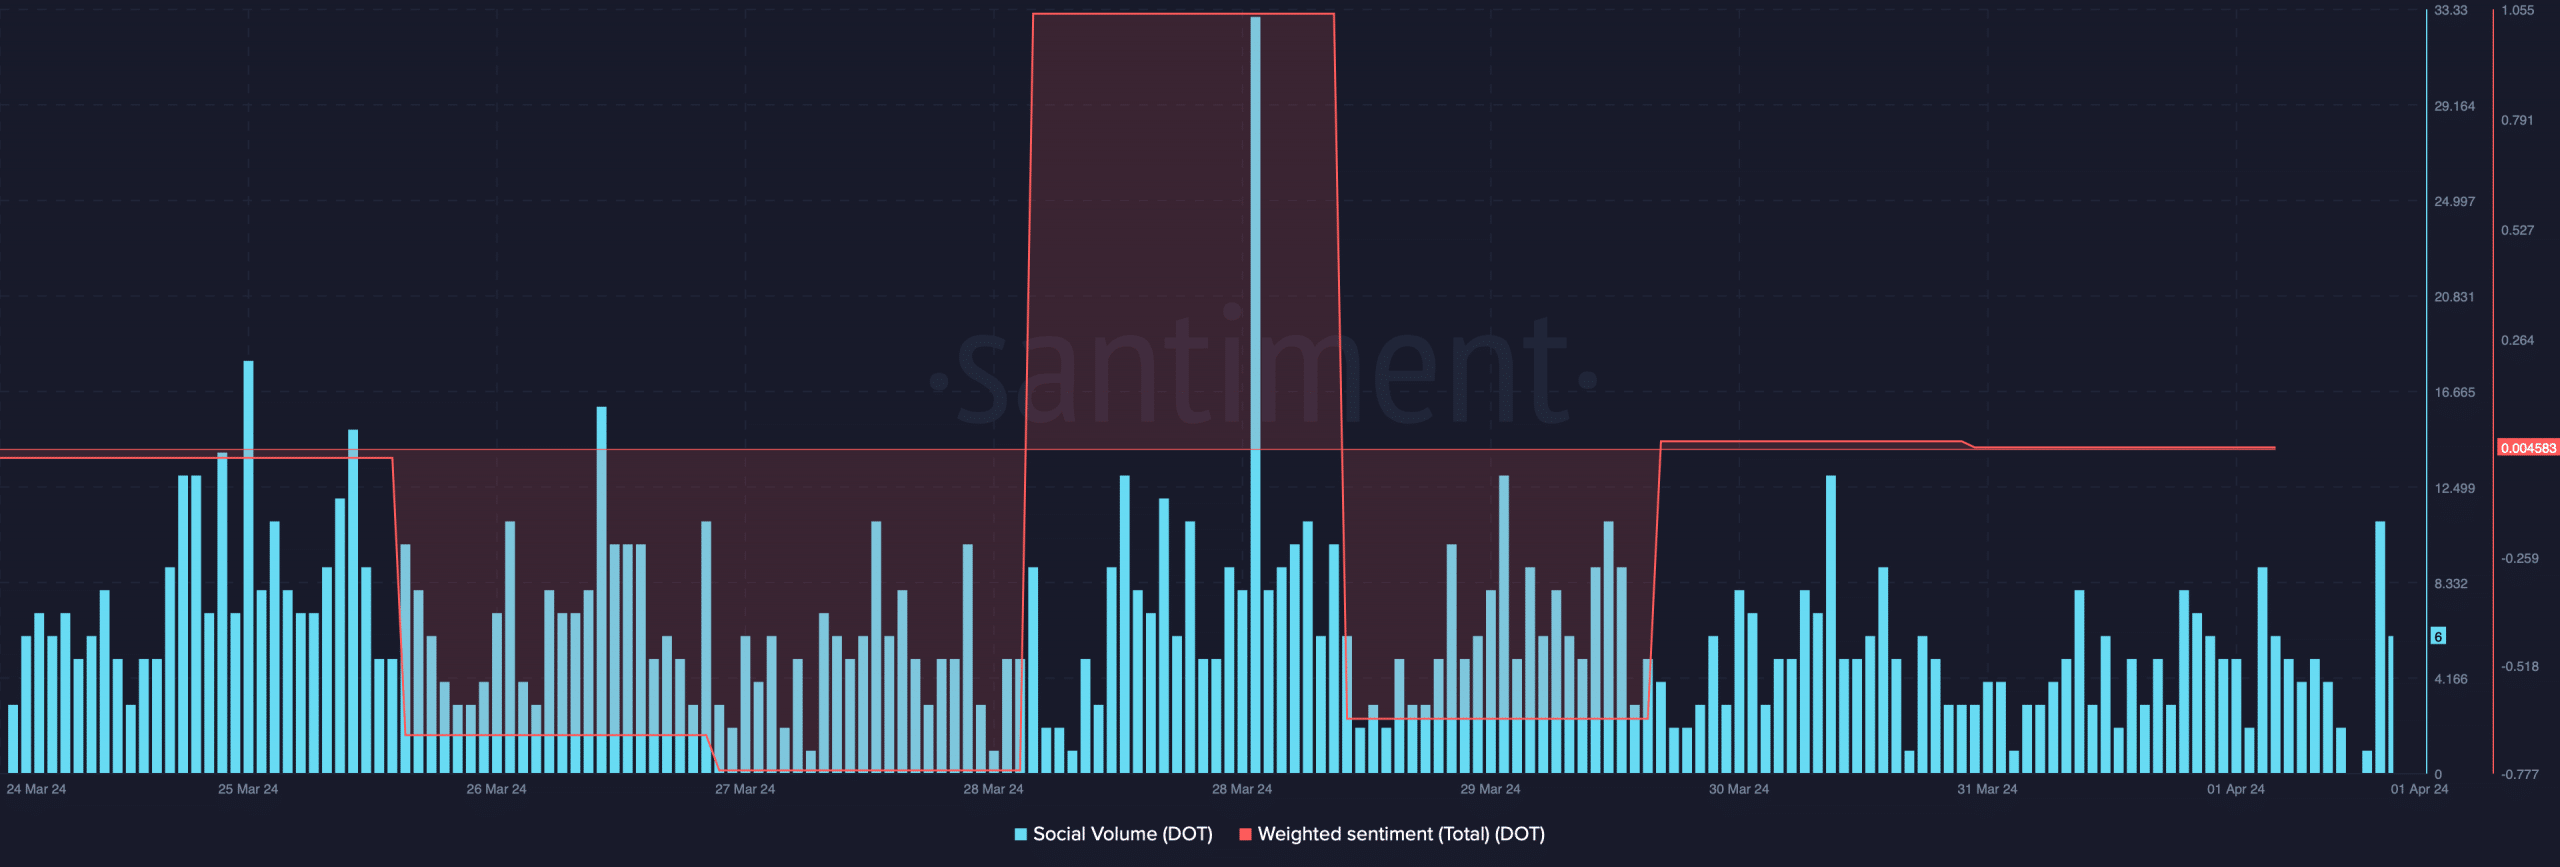
Source: Santiment
Things in the derivatives market also looked pretty bearish. Our analysis of Coinglass’ data revealed that DOT’s Funding Rate increased.
This meant that derivatives buyers were actively buying DOT at its lower price. Moreover, its Open Interest went up while its price dropped.
A hike in the metric usually suggests that the on-going price trend might continue, further hinting at a continued price decline.
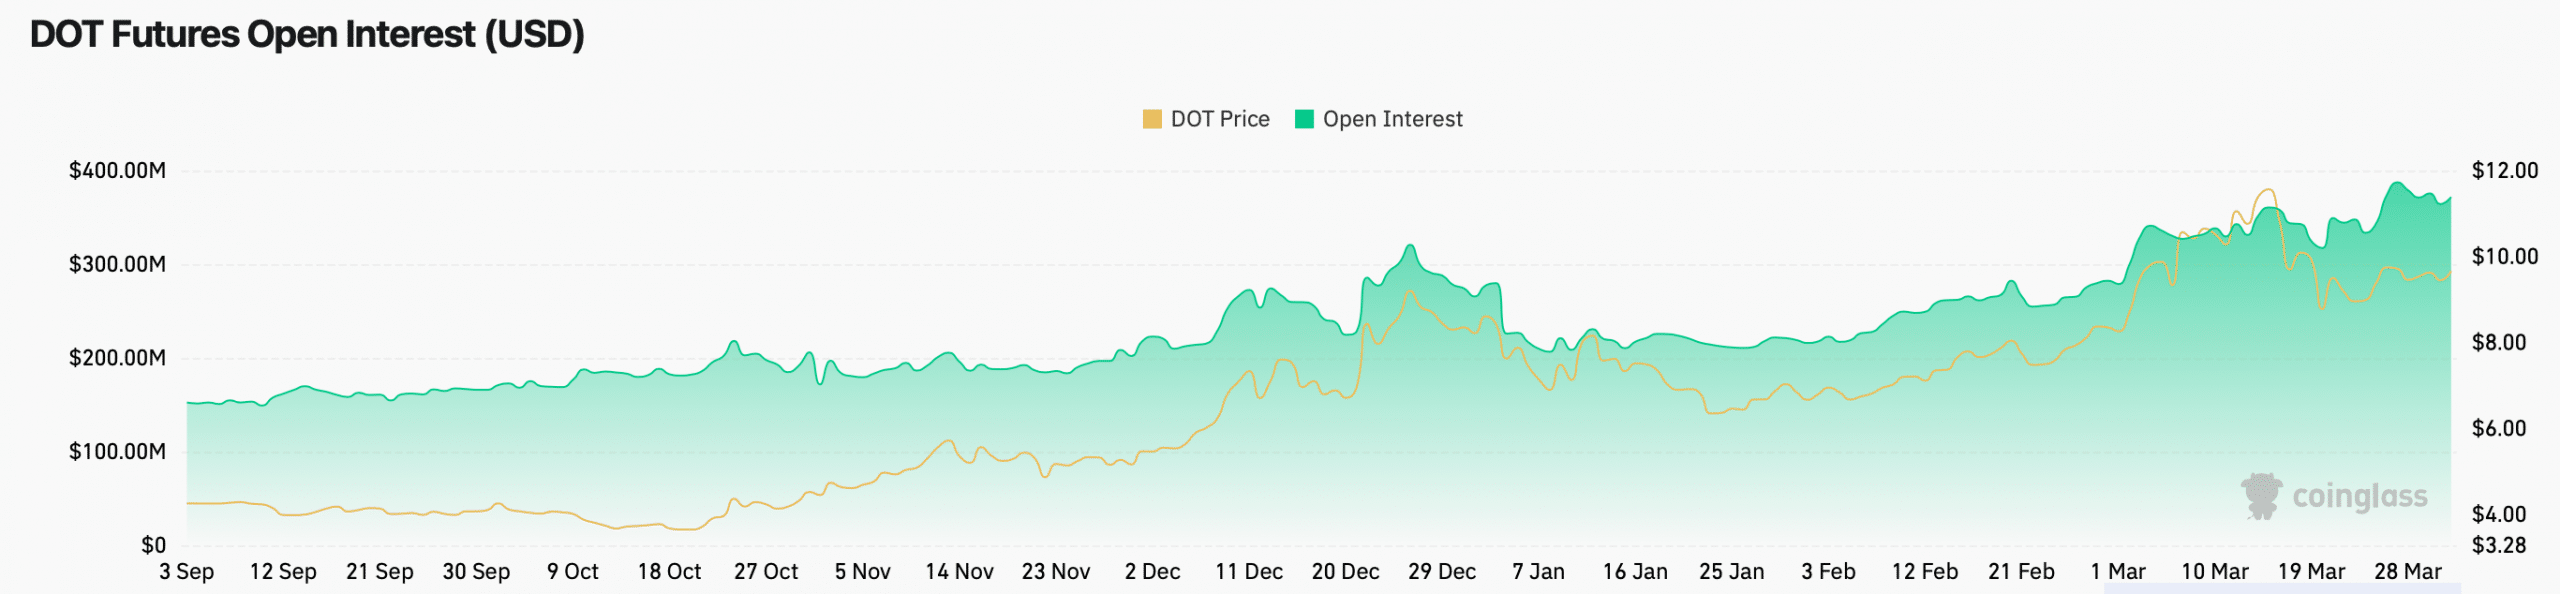
Source: Glassnode
Polkadot’s technical indicators also supported the bears. Both Polkadot’s Relative Strength Index (RSI) and Money Flow Index (MFI) registered downticks in the last few days.
Its MACD also displayed a clear bearish upperhand in the market.
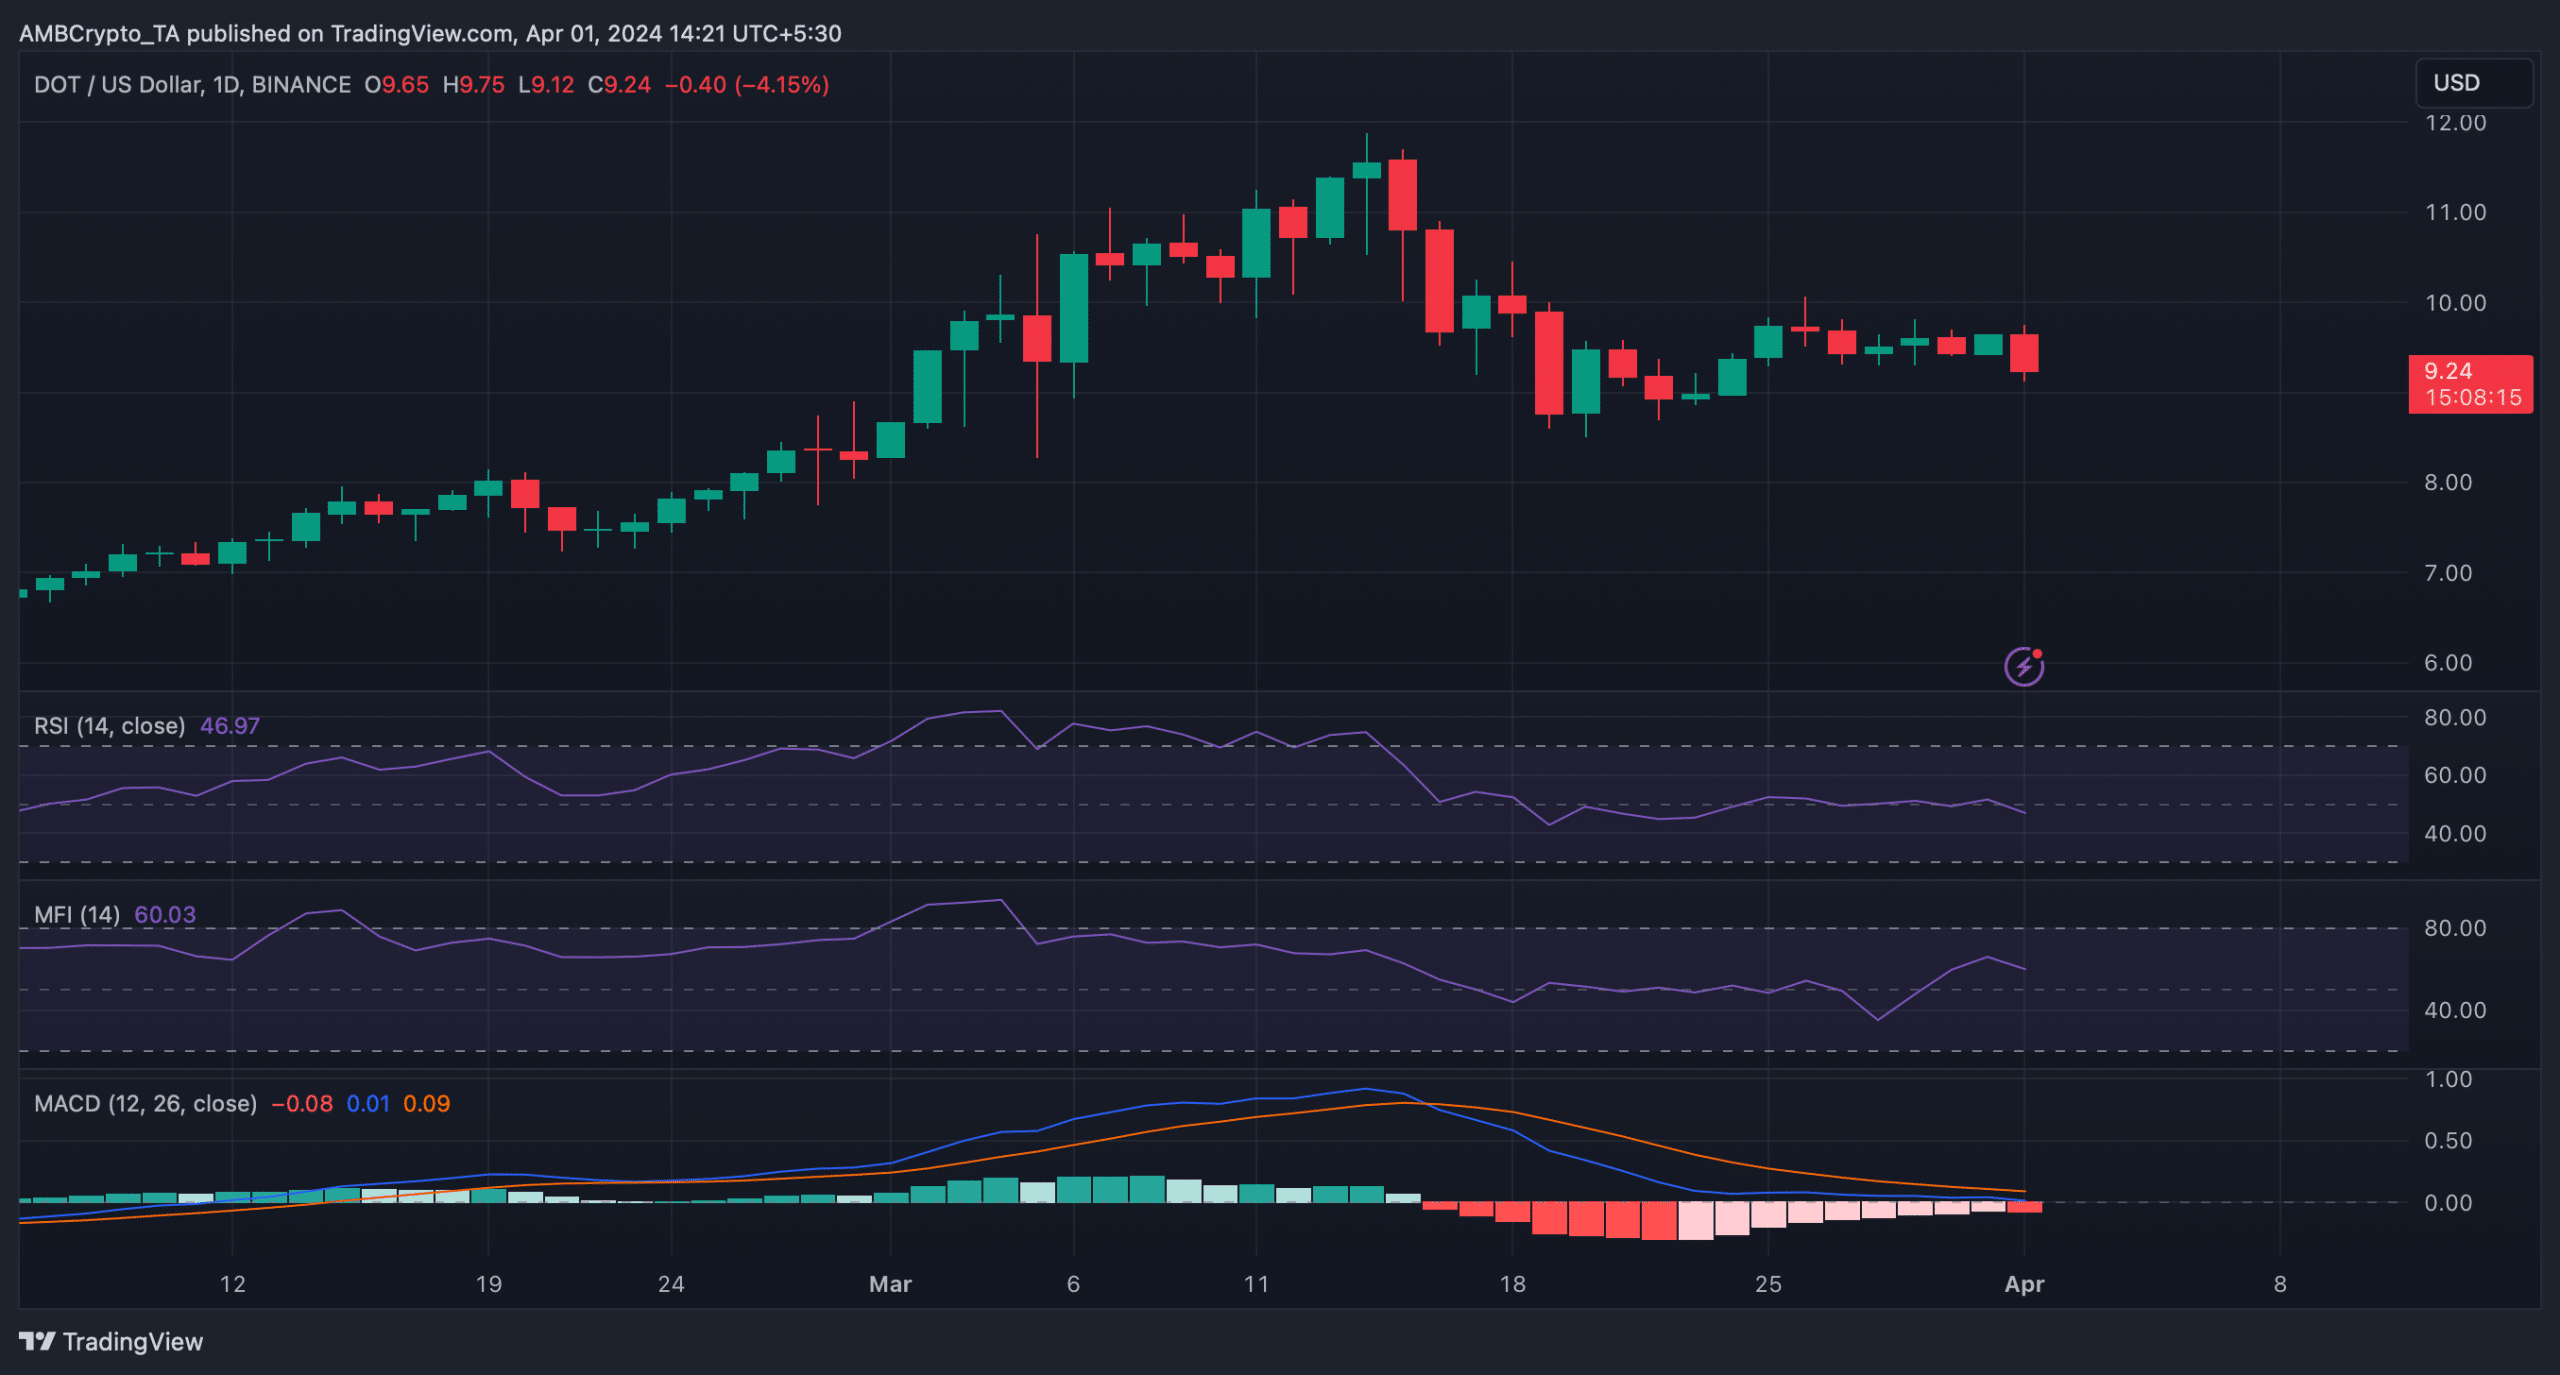
Source: TradingView
Network activity is also dropping
Apart from price, Polkadot’s network activity has also been dwindling for quite a few weeks.
Read Polkadot’s [DOT] Price Prediction 2024-25
AMBCrypto’s analysis of Artemis’ data revealed that the blockchain’s daily active addresses have dropped over the last few months.
As a result, the blockchain’s number of transactions also followed a similar declining trend. Things in terms of captured value were also not up to par, as its revenue dropped.
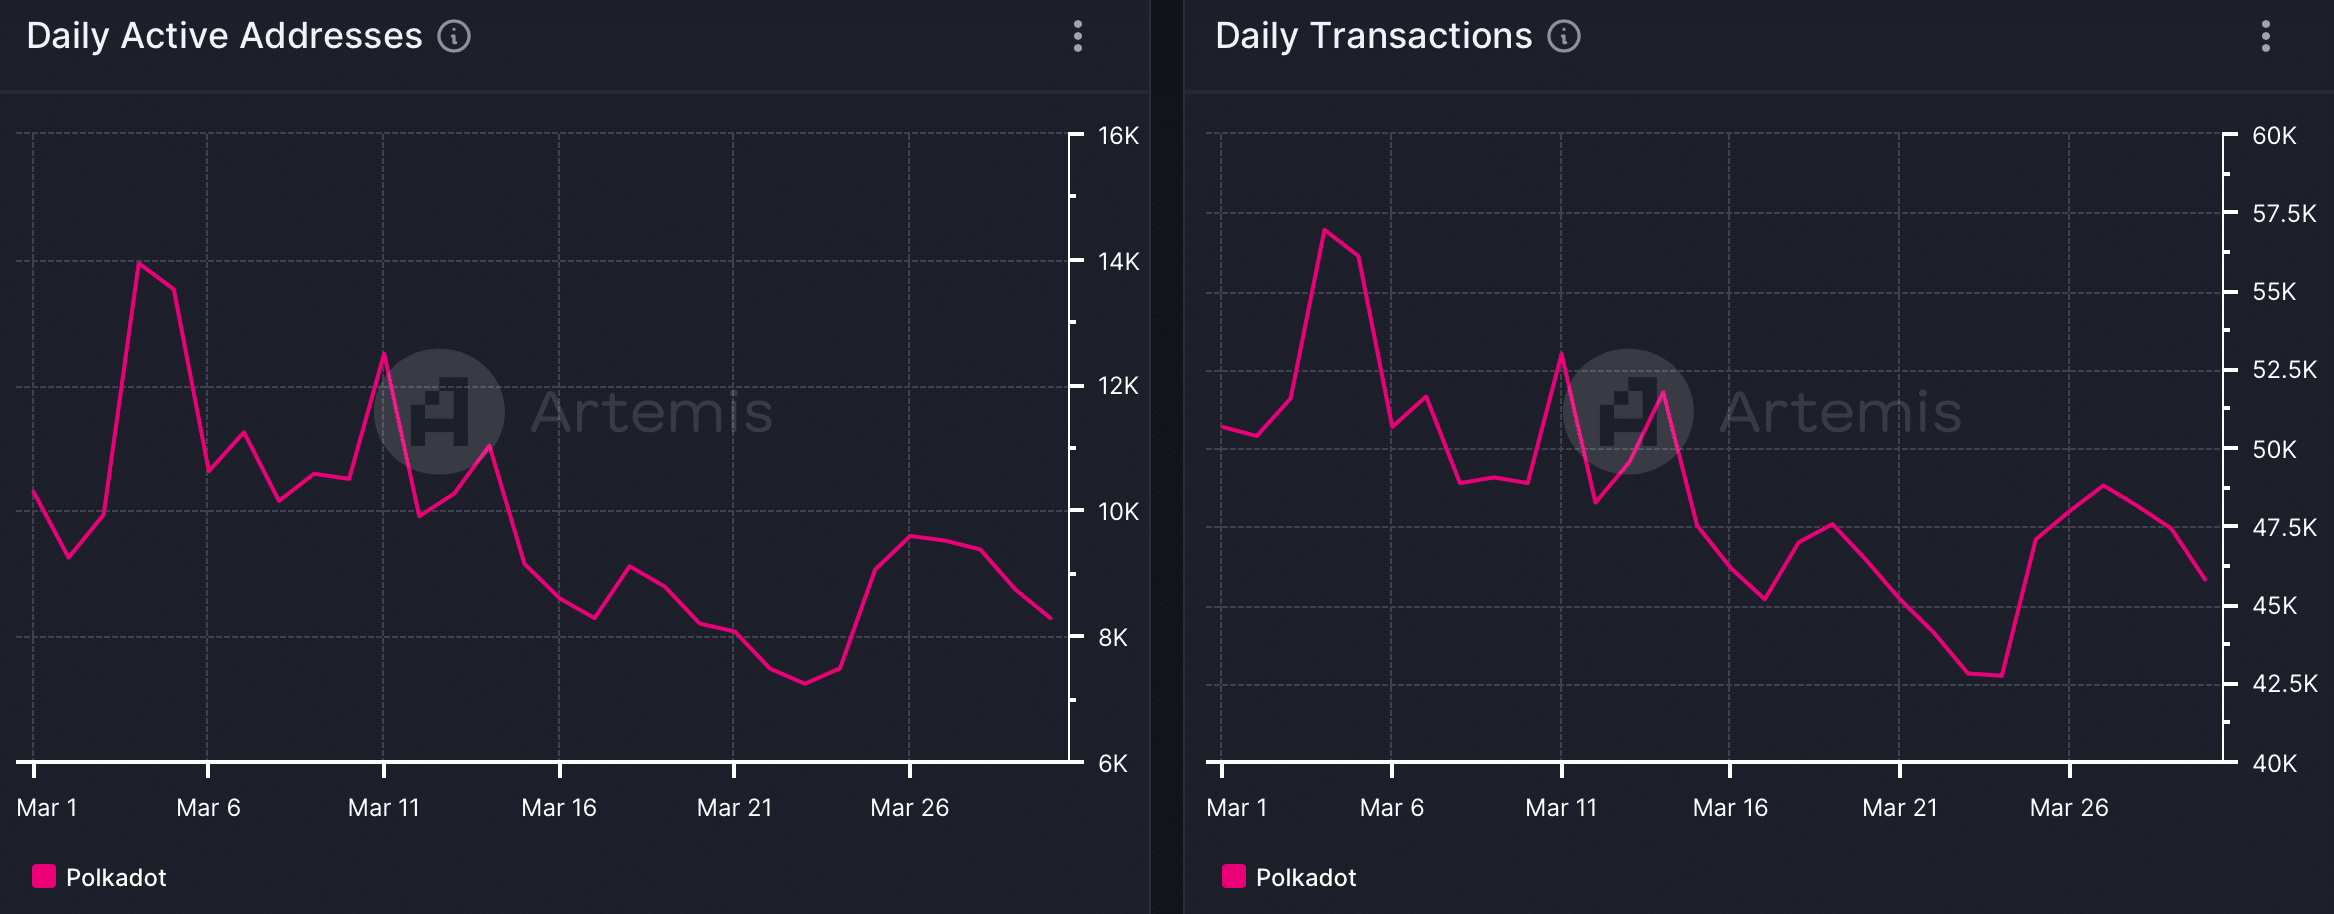
Source: Artemis