- WIF briefly crossed the $4 price mark.
- Its Chaikin Money Flow hints at the possibility of a reversal.
Solana-based meme coin dogwifhat [WIF] traded briefly above the $4 price mark on 29th March to register a new all-time high, according to CoinMarketCap’s data. At $3.68 per WIF at press time, the memecoin has since witnessed a 7% price correction.
Despite the drop, WIF leads as the crypto asset with the most gains in the past 24 hours. The double-digit price growth recorded during that period has pushed its market capitalization above $4 billion, making it the third largest meme asset after Dogecoin [DOGE] and Shiba Inu [SHIB].
WIF on a 1-day chart
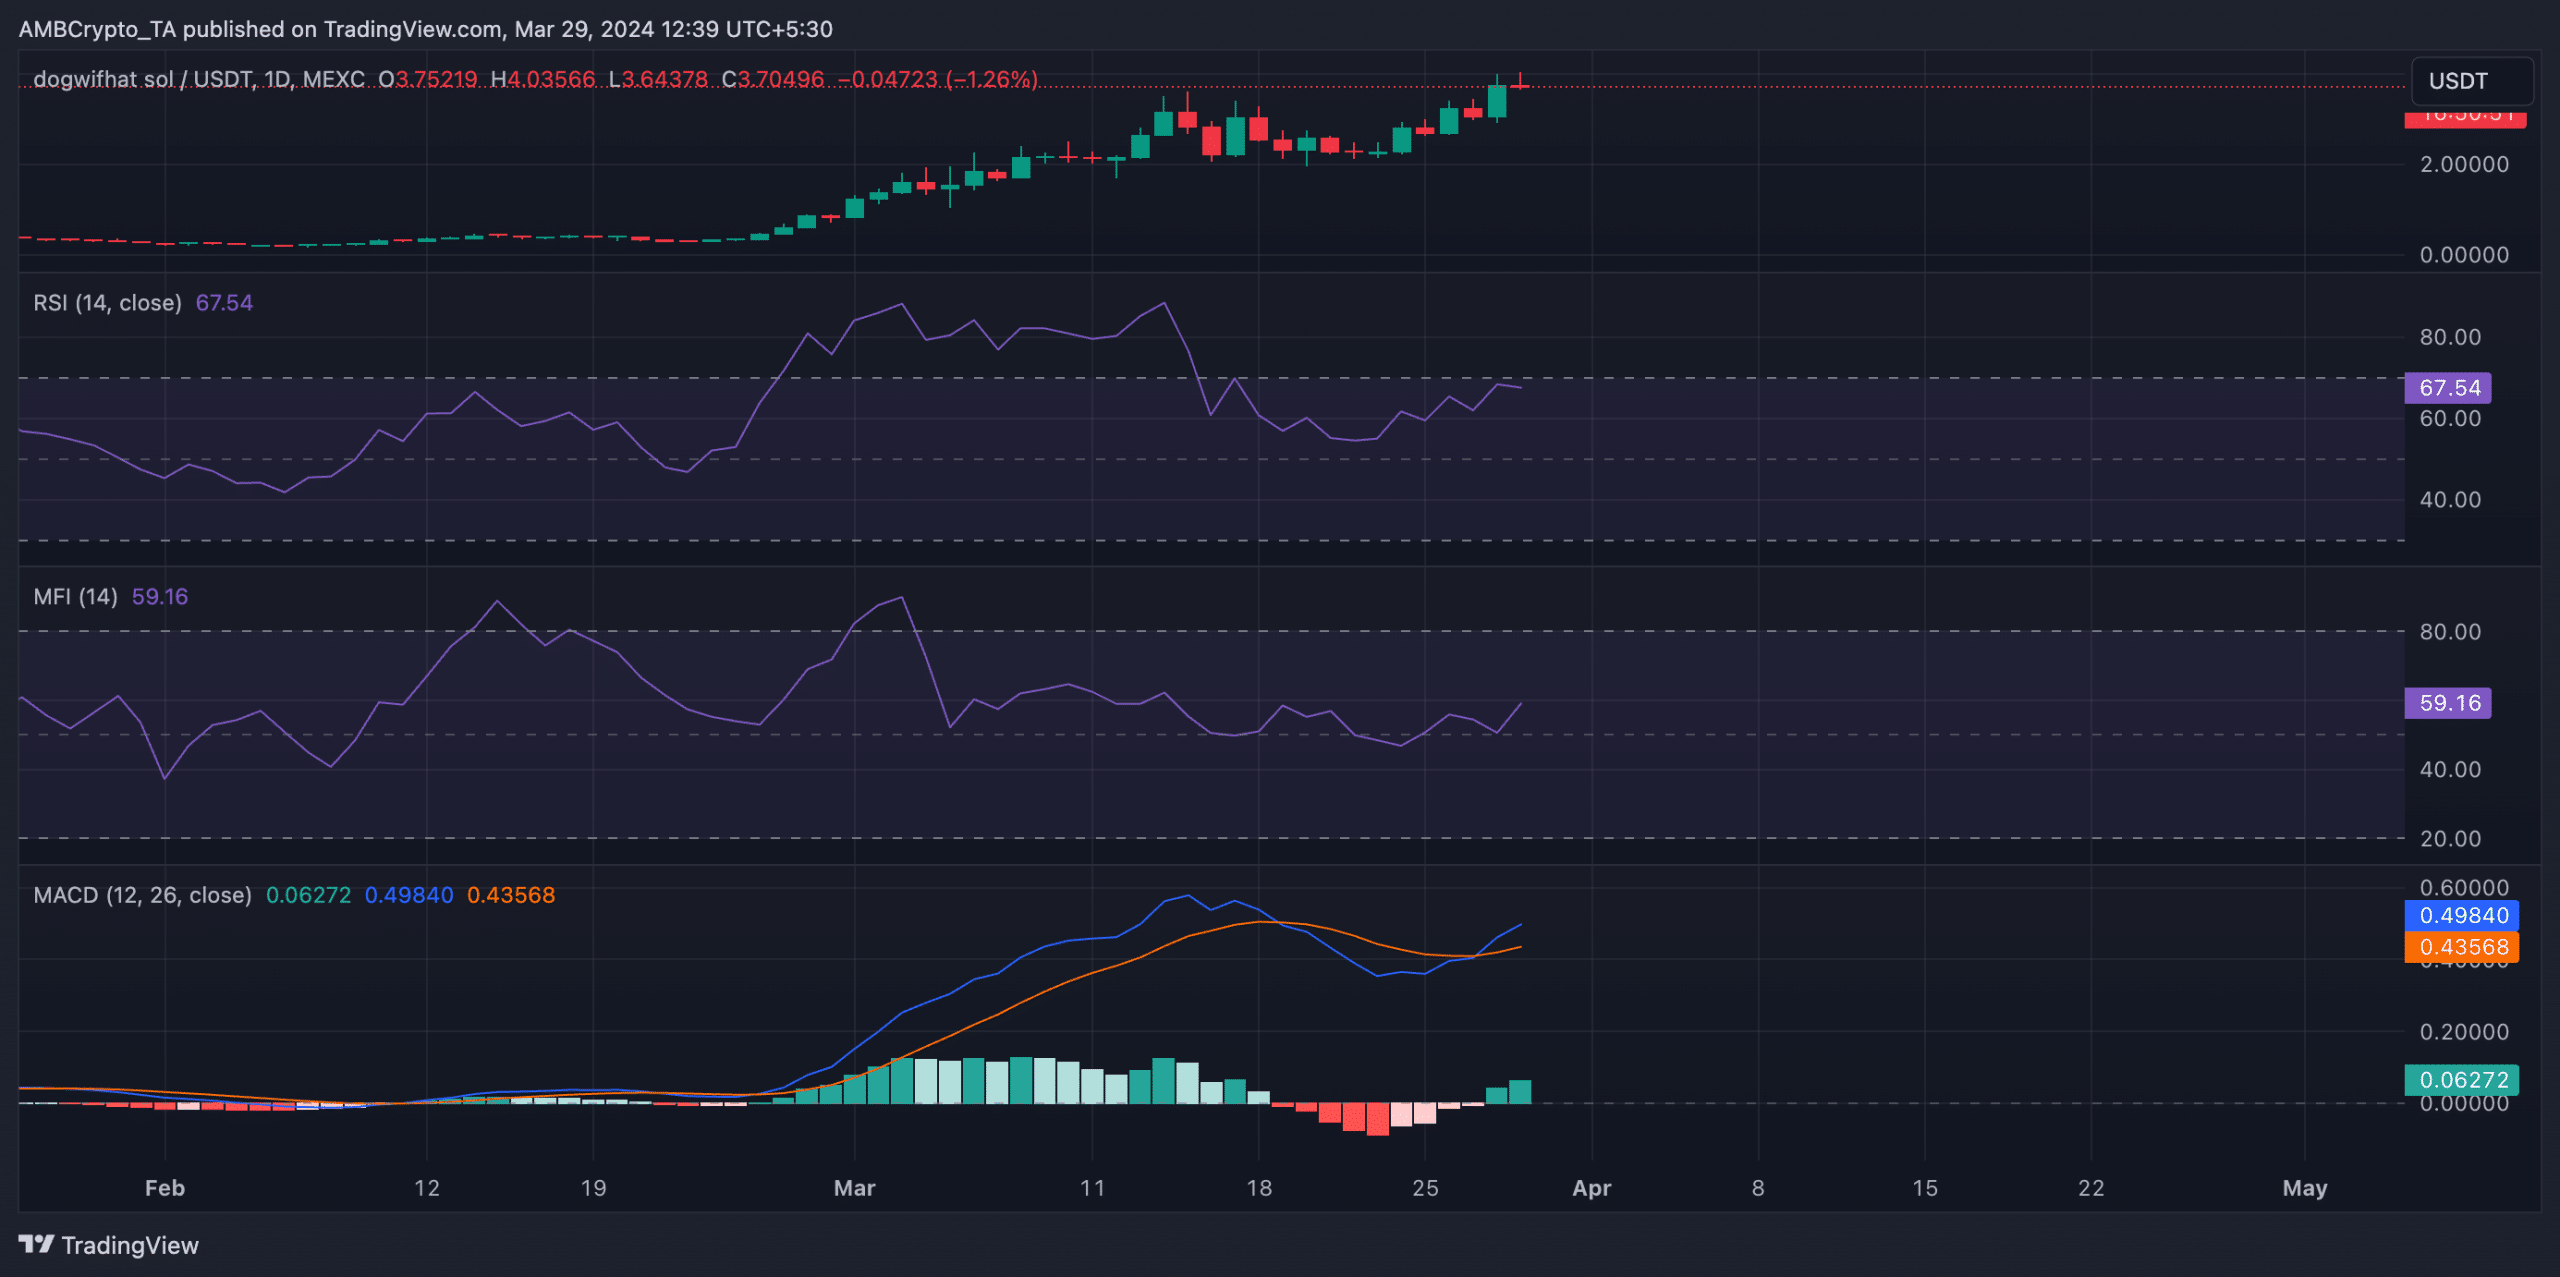
An assessment of WIF’s performance on a daily chart revealed an uptick in demand for the meme coin. As of this writing, its key momentum indicators were positioned above their respective neutral lines.
For example, WIF’s Relative Strength Index (RSI) was 67.31, while its Money Flow Index (MFI) was 59.02. These values showed that WIF’s spot market participants preferred accumulating the memecoin rather than selling it for profit.
Confirming the bullish trend, readings from WIF’s Moving Average Convergence Divergence (MACD) revealed that the MACD line crossed above the signal line on 27th March, ushering in the current bull cycle.
This intersection is considered bullish because it indicates that the shorter-term moving average has moved higher than the longer-term moving average, presenting an opportunity to buy for profit.


Source: WIF/USDT on TradingView
In the memecoin’s derivatives market, trading volume has surged by 37% in the past 24 hours, totaling $2.4 billion. Likewise, its open interest has increased by 27% during the same window period, according to Coinglass’ data.
When an asset’s derivatives market open interest increases, the number of outstanding contracts has risen. This signals an uptick in market participation.
High open interest, combined with the positive funding rates that trail WIF, showed that investors have continued to open bets in favor of a sustained price rally.
Realistic or not, here’s WIF’s market cap in BTC’s terms
A slight pull-back on the horizon?
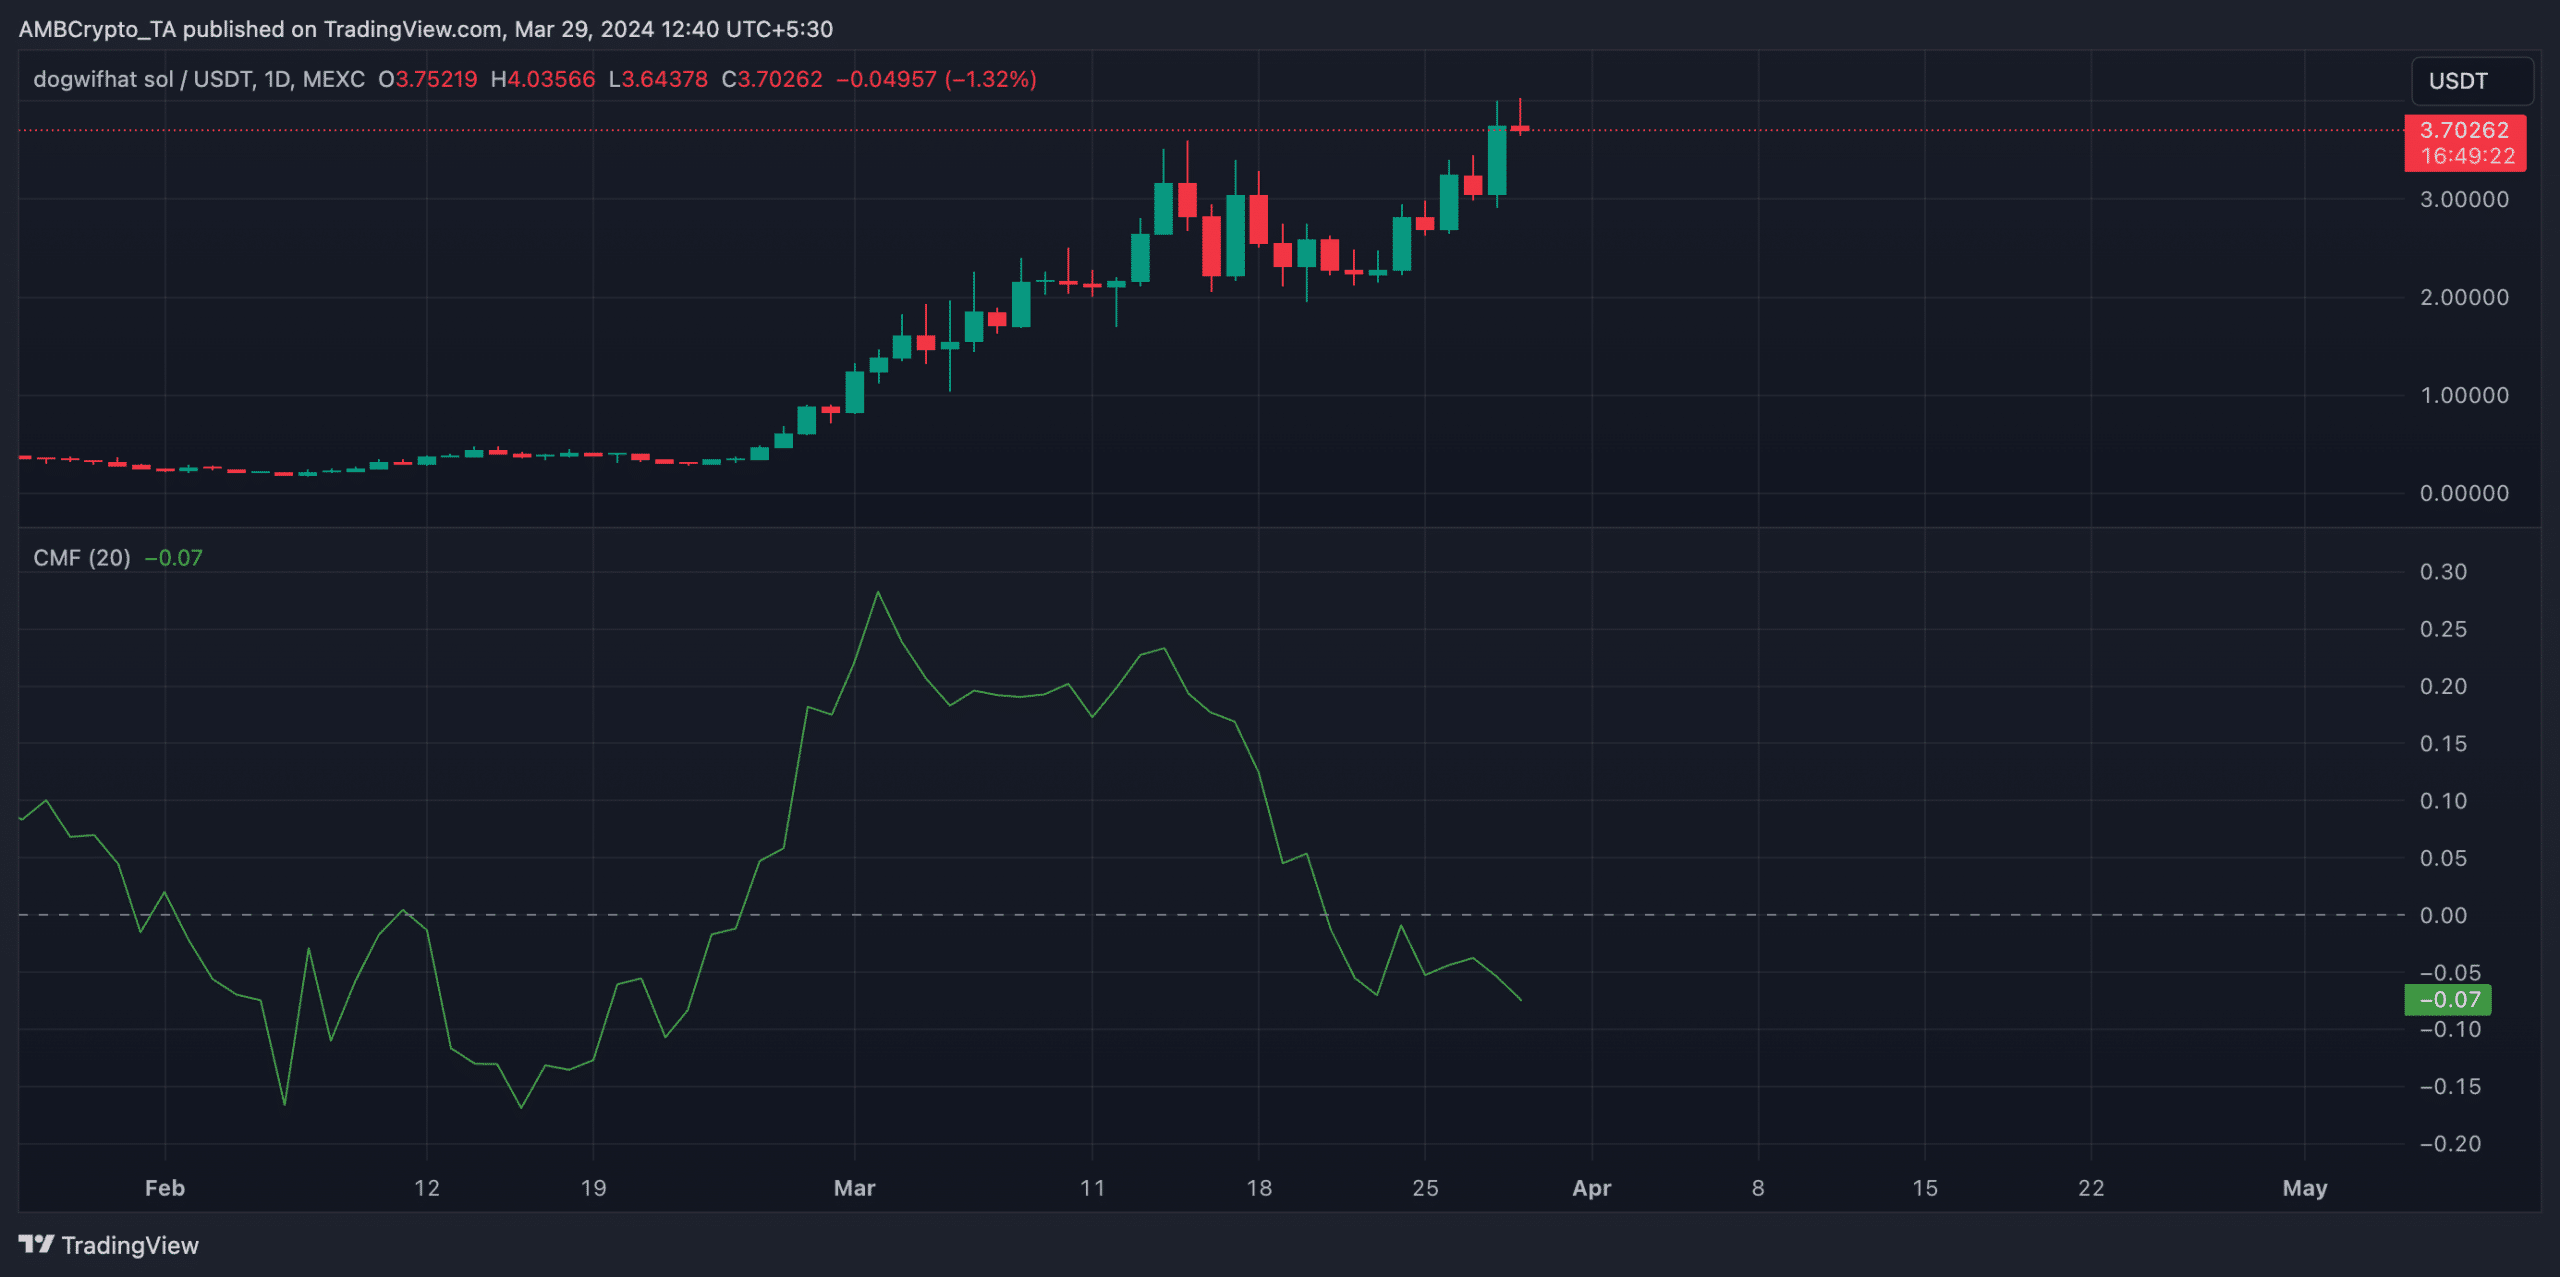
Despite the 360% growth in WIF’s price in the last month, its Chaikin Money Flow (CMF) has trended downward since 16th March. This has created a bearish divergence, often preceding an eventual price correction.
This indicator tracks how money flows into and out of a crypto asset. The disparity in an asset’s price movement and CMF implies that the price growth is driven by a small pool of buyers. It could aso mean that selling pressure may rise despite the price rally.


Source: WIF/USDT on TradingView


Leave a Reply