

- The CVD revealed that shorts outpaced longs but it could be great for the price.
- A declining Open Interest at this time alongside high volatility suggested caution.
Bitcoin’s [BTC] bounce from $60,731 to $63,049 has not deterred traders from opening short contracts, AMBCrypto confirmed. But historically, a high number of short positions could be great for BTC’s price.
SignalQuant, an on-chain analyst also aligned with our viewpoint. The analyst had posted his thoughts about the matter on CryptoQuant. From the post, SignalQuant considered the Taker Buy/Sell Cumulative Volume Delta (CVD).
One says it’s recovery time
Unlike the spot CVD, the Taker Buy/Sell CVD tracks activity in the derivatives market. For those unfamiliar, it gives the difference between longs and short positions.
The green area (as shown below) infers that long exceeded shorts. But at press time, the metric was in the read region, indicating that shorts were dominant.
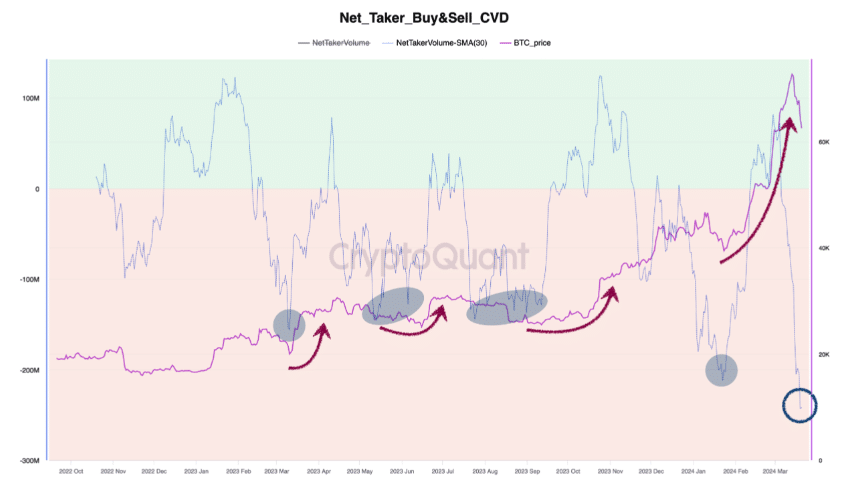
Source: CryptoQuant
The author concluded the analysis by noting that,
“However, the historical pattern shows that after a period of dominant market shorts, Bitcoin price either moves sideways or rebounds sharply.”
However, there was another twist to Bitcoin’s situation. This time, it involved the Open Interest (OI). OI is the number of outstanding contracts in the futures market.
Sometimes back, AMBCrypto reported how the OI was one of the major catalysts that triggered BTC’s rise to $73,000. At press time, Glassnode’s data showed that the OI has been decreasing.
This indicates that traders are closing their previously open contracts. If we go by a similar situation that happened during the 2021 bull cycle, Bitcoin’s correction might not be over.
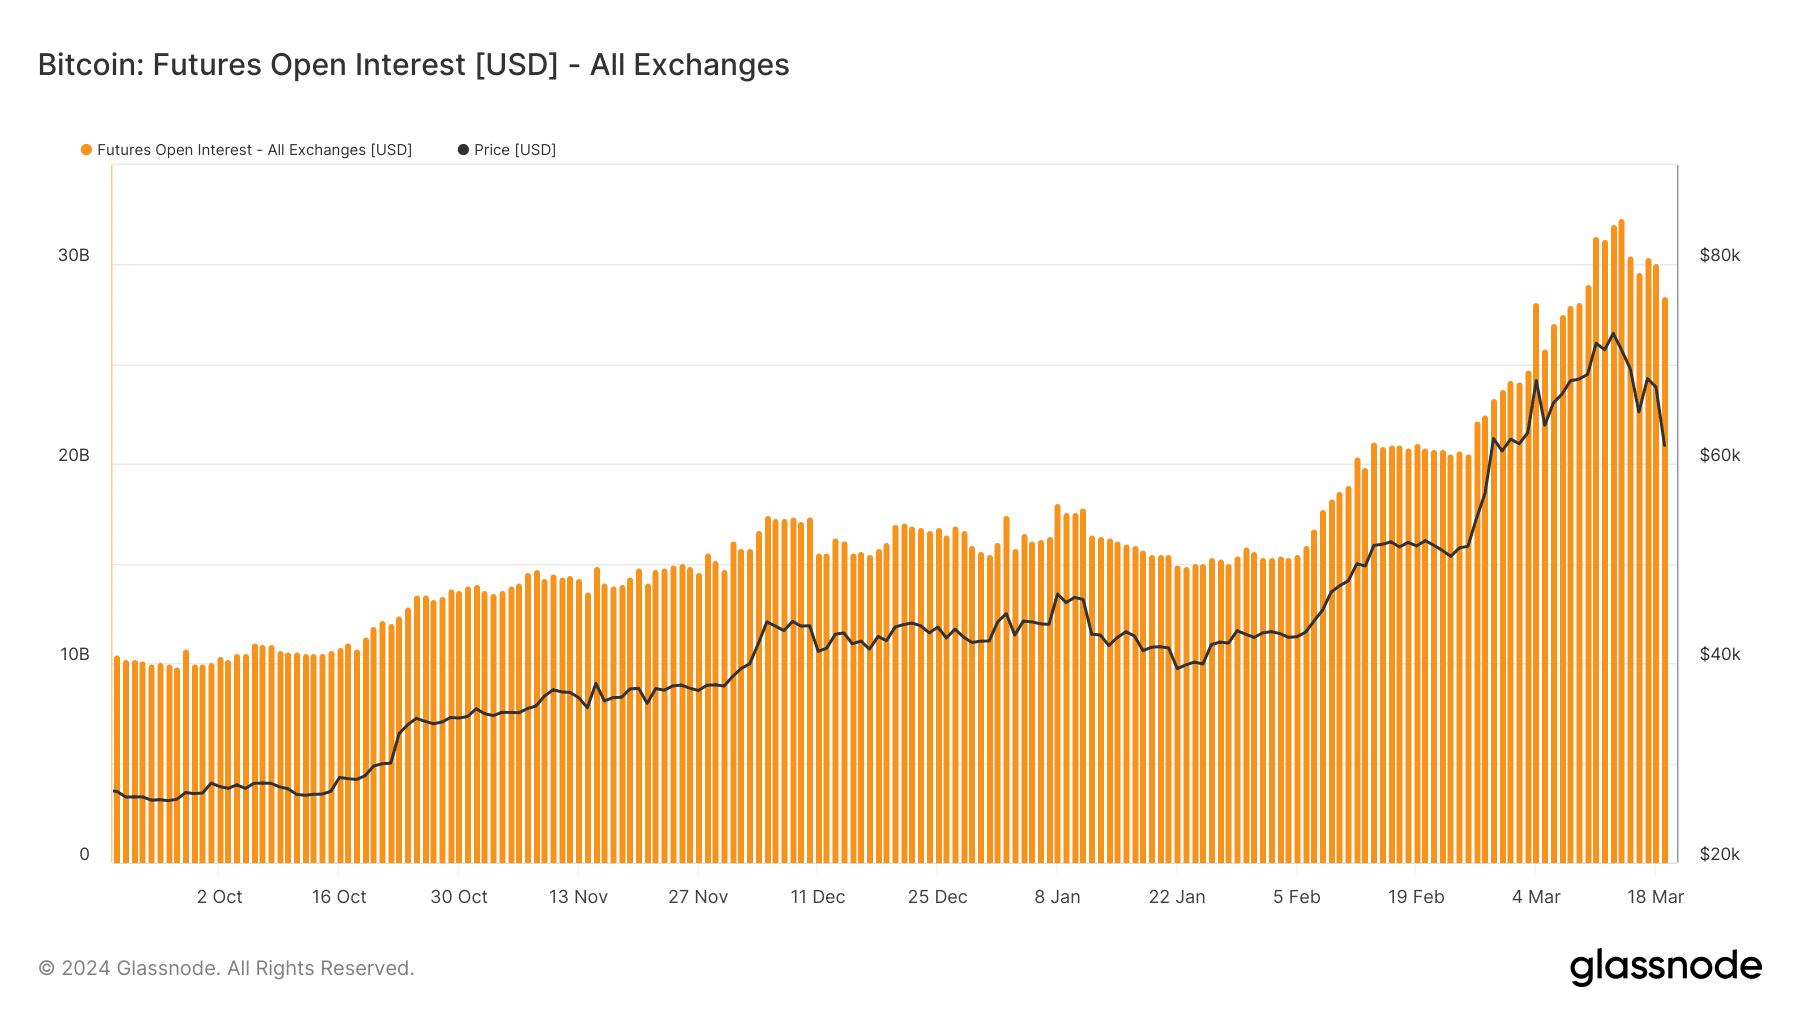
Source: Glassnode
The other opposes
If this is the case, the price of Bitcoin might pull back as low as $58,000. Despite the recent decline, BTC’s Year-To-Date (YTD) performance was a 42.60% increase.
However, another nosedive from the press time level could see this number cut short. Should Bitcoin’s price decrease, it might not considering how past cycles have been.
For example, when the coin approached the 2016 halving, the uptrend it had at that time, went off. During the 3rd halving in 2020, a similar scenario occurred.
Furthermore, AMBCrypto assessed the Realized Volatility. By definition, Realized Volatility looks at the returns a cycle has given compared with what has happened in the past.
The result of this tells if it is risky or not to trade BTC. Low values of the Realized Volatility imply it might not be risky to long or short Bitcoin.
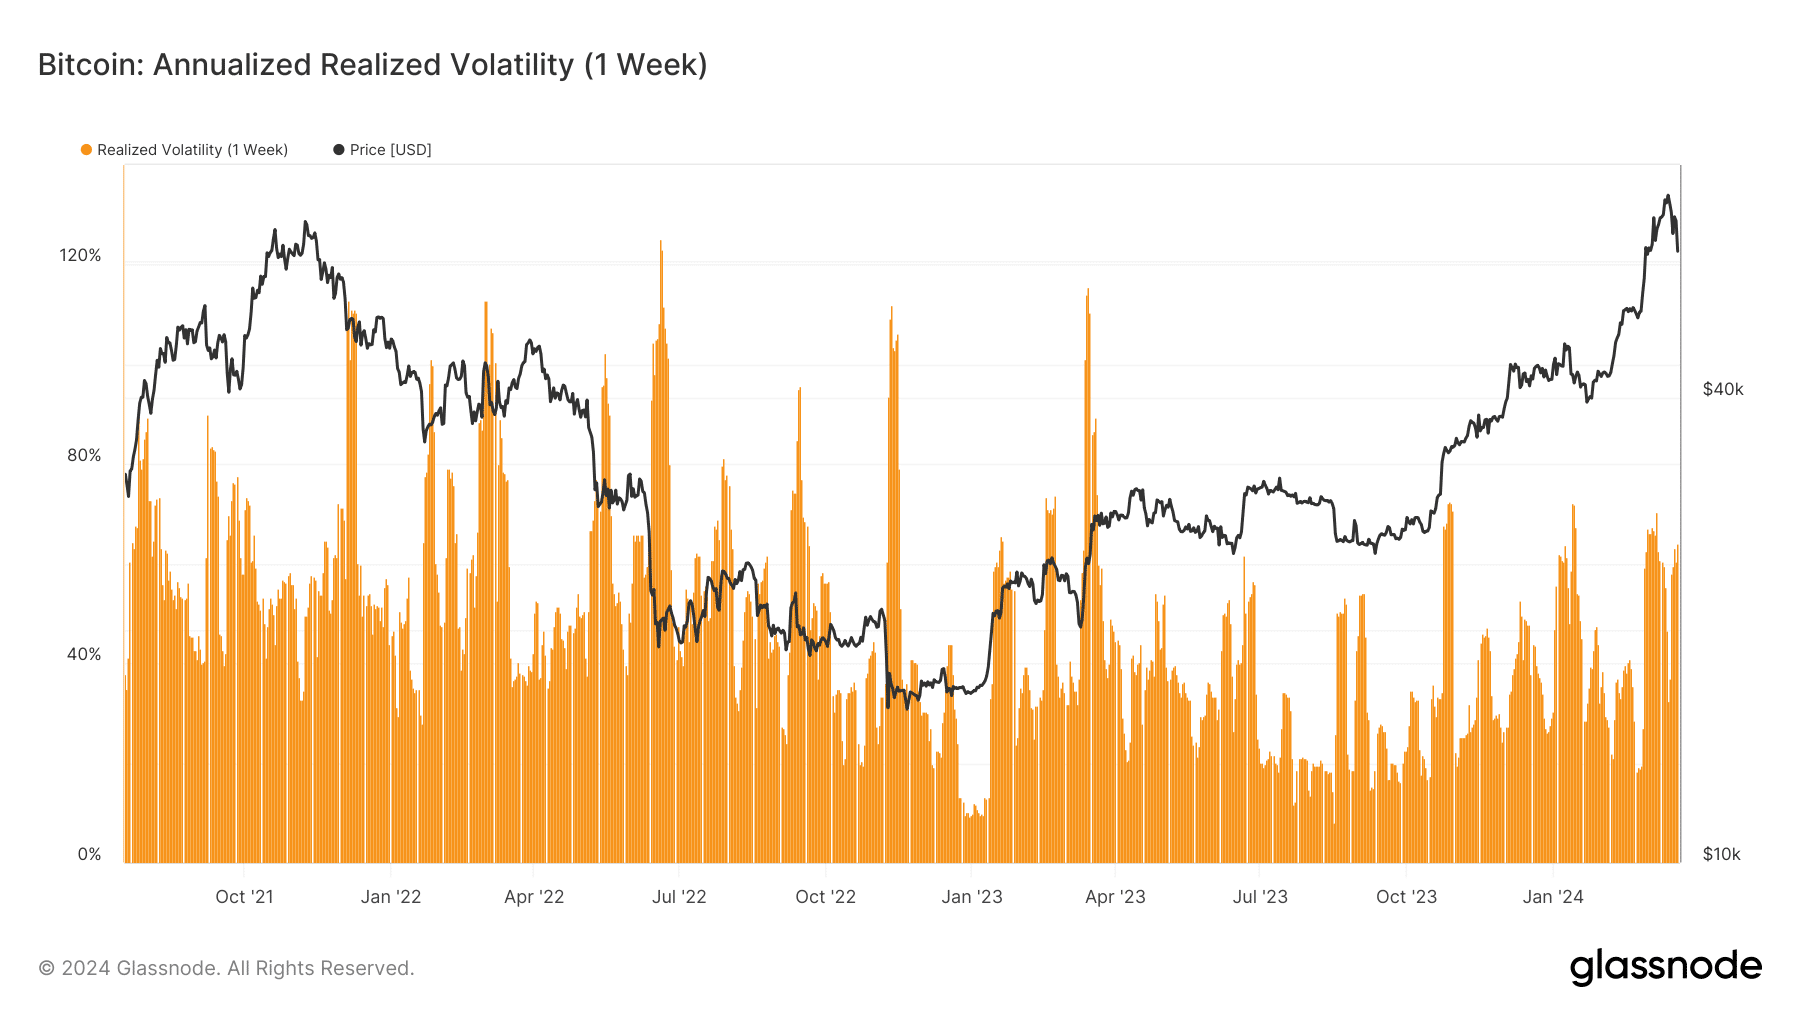
Source: Glassnode
Realistic or not, here’s BTC’s market cap in ETH terms
But at press time, the one-week Realized Volatility was 60.6% indicating a high-risk phase. Therefore, it might be better for traders to avoid opening BTC contracts at this time.
As things stand, prices could fluctuate either way, and high-leverage bets could face massive liquidation. In addition, the value of BTC has more tendency to decline once more before a notable recovery.