

- BTC was up by 2% in the last 24 hours.
- Metrics suggested that selling sentiment was dominant in the market.
Bitcoin’s [BTC] price witnessed a major correction of late as its value touched the $67k mark. The king of cryptos, however, recovered from that plunge and managed to paint its daily chart green.
Let’s have a look at BTC’s state and how different exchanges and investors behaved during this entire episode.
Selling pressure on Bitcoin went up
Bitcoin’s price took a major blow on the 15th of March as its value touched $67,200. During that price plummet, major exchanges and investors acted interestingly.
Lookonchain’s latest tweet revealed that a Binance deposit wallet moved 4,637 BTC, which were worth over $329 million to a Binance hot wallet. Coincidentally, the deposit wallet also moved 4,876 BTC, worth $319 million, to Binance Hot Wallet during the BTC drop on the 5th of March.
AMBCrypto reported earlier how BTC’s liquidation increased during the price correction. To be precise, Bitcoin’s liquidation volume surged to over $143.6 million on the 14th of March.
IntoTheBlock’s recent tweet also highlighted that selling pressure on BTC was high. As per the tweet, over $750 million in BTC was withdrawn from exchanges, the highest since May 2023. The majority of these sell-offs originated from Bitfinex and Kraken.
Bitcoin’s path to recovery
Despite the rise in liquidation, BTC managed to somewhat recover from the horrors as its daily chart turned green. According to CoinMarketCap, Bitcoin was up by more than 2% in the last 24 hours.
At the time of writing, BTC was trading at $68,996.20 with a market capitalization of over $1.36 trillion.
Since the king of cryptos was recovering, AMBCrypto planned to have a look at its metrics to see what they had to say. An analysis of CryptoQuant’s data revealed that BTC’s exchange reserve was decreasing, meaning that selling pressure dropped.
However, the rest of the metrics looked bearish. For example, its aSORP was red.
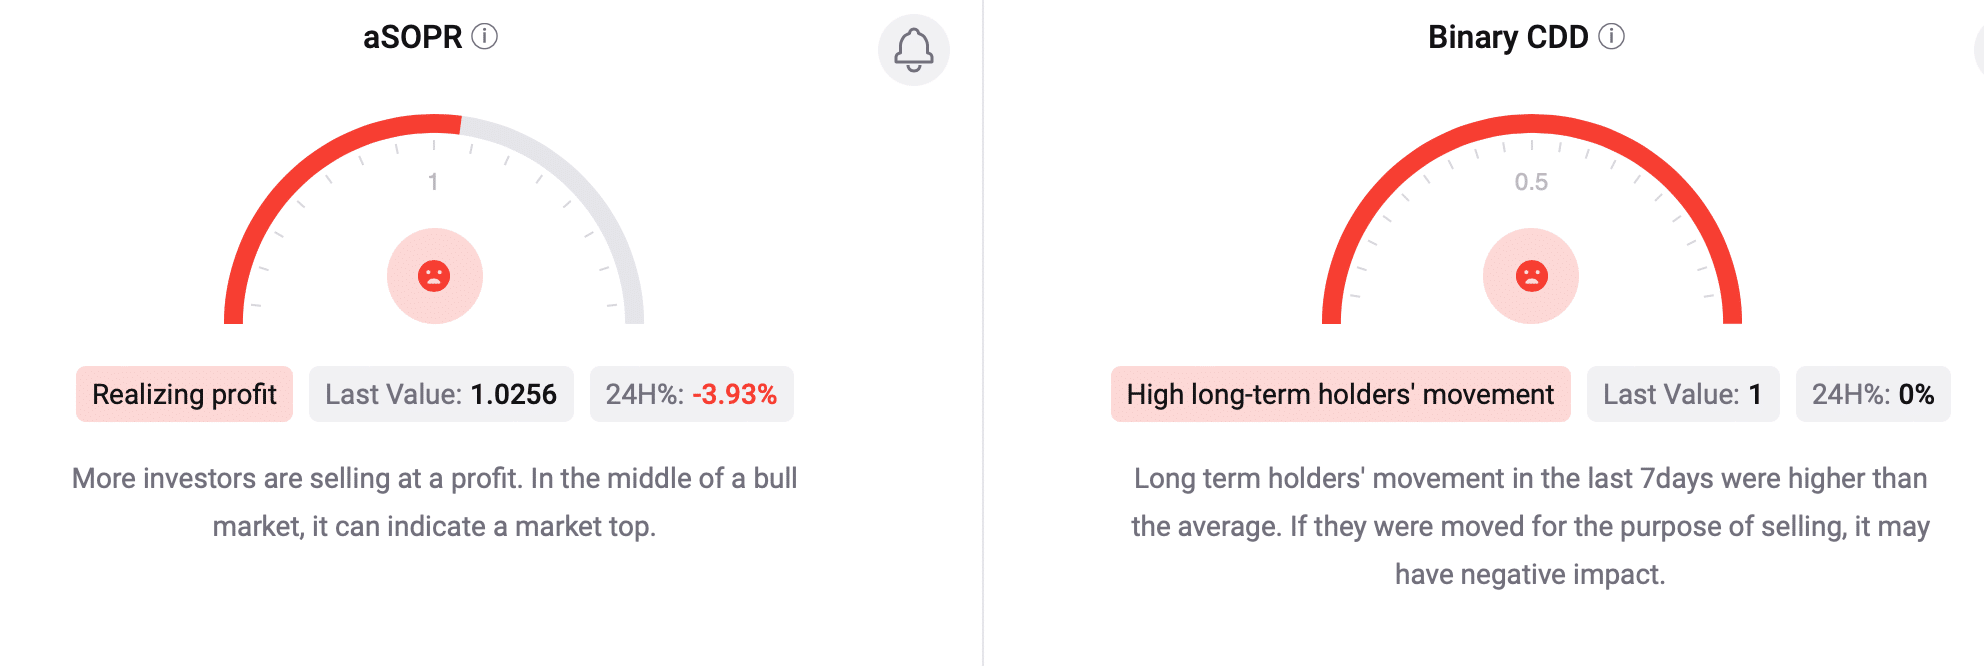
Source: CryptoQuant
This means that more investors are selling at a profit. Its binary CDD also remained red, suggesting that long-term holders’ movements in the last 7 days were higher than average.
If they were moved for the purpose of selling, it may have a negative impact. Additionally, selling sentiment remained dominant both among US and Korean investors as BTC’s Coinbase and Korea premiums were red.
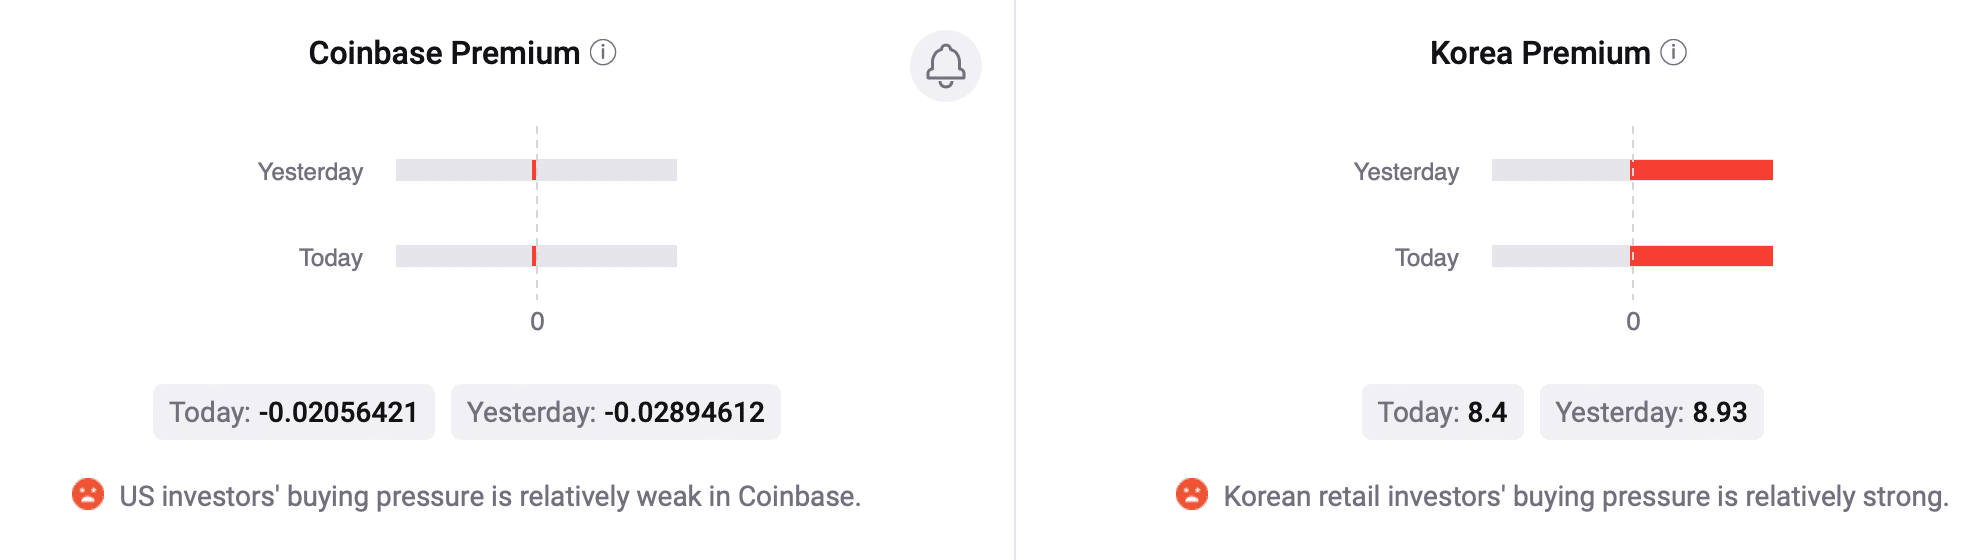
Source: CryptoQant
Read BTC’s [BTC] Price Prediction 2024-25
The technical indicator MACD supported the sellers as it displayed a bearish crossover. Bitcoin’s Relative Strength Index (RSI) also looked pretty bearish as it went down.
These indicators suggest that the chances of BTC once again falling victim to a price correction are high.
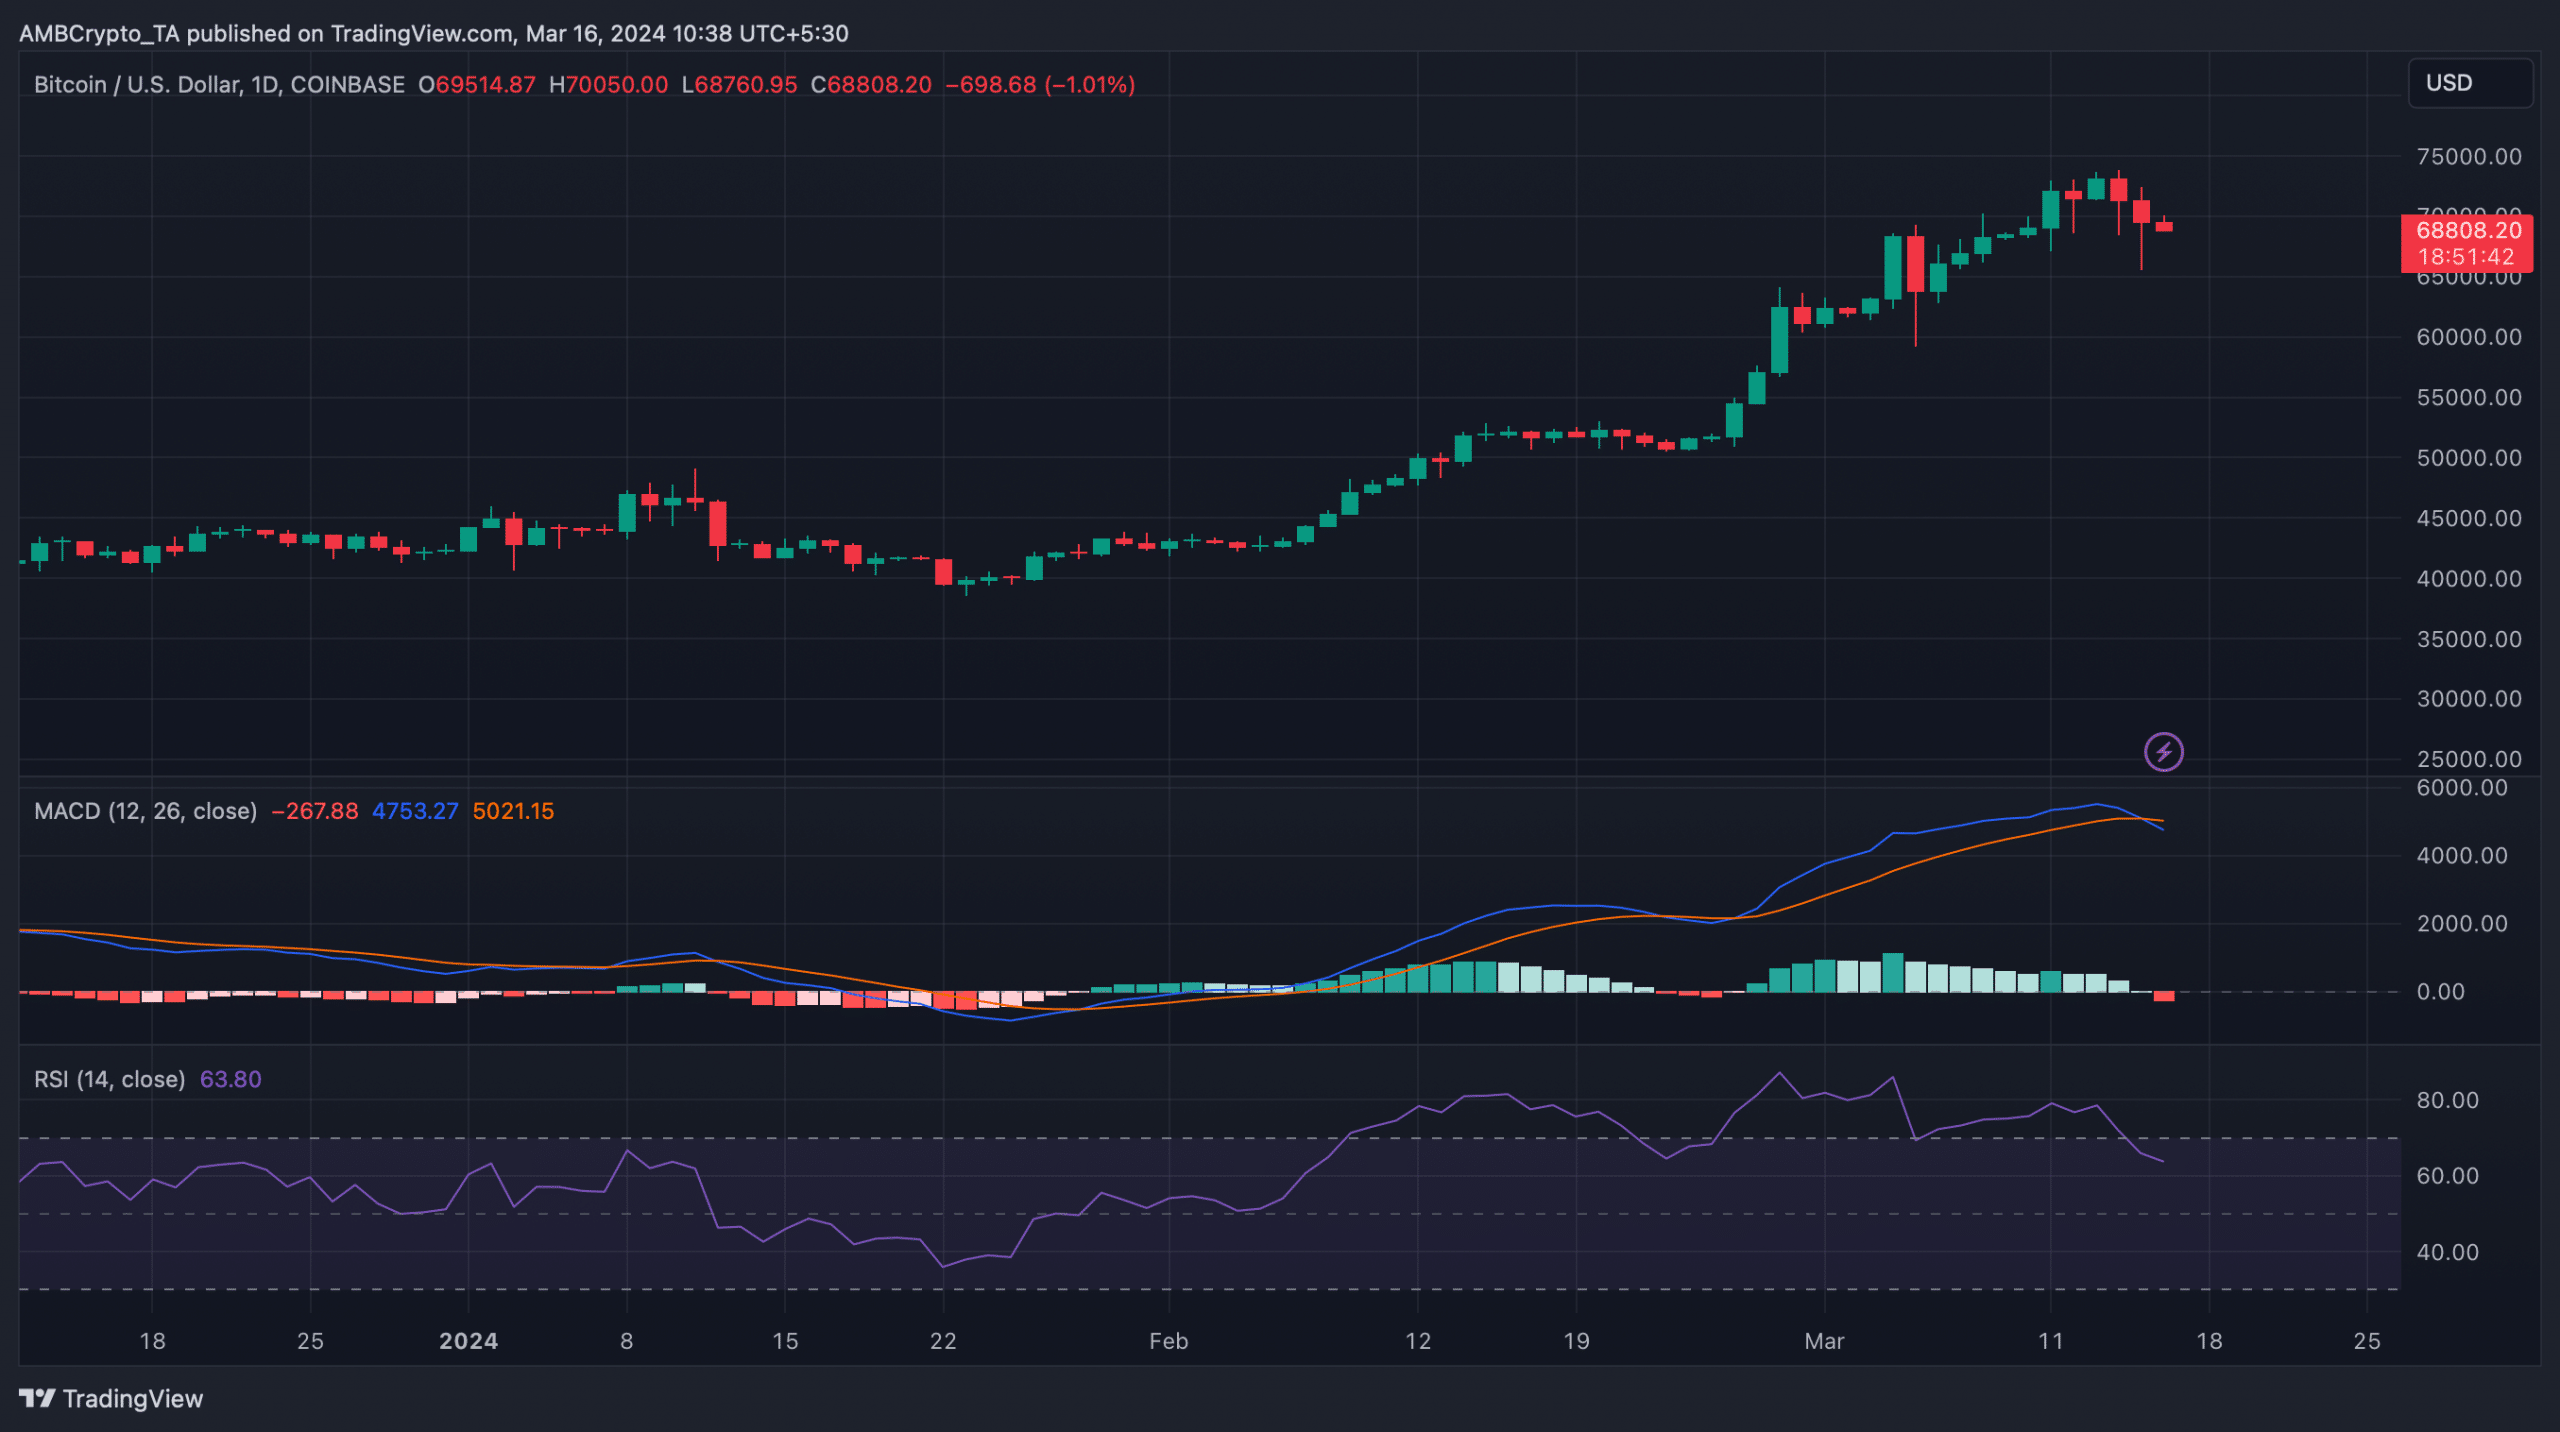
Source: TradingView