

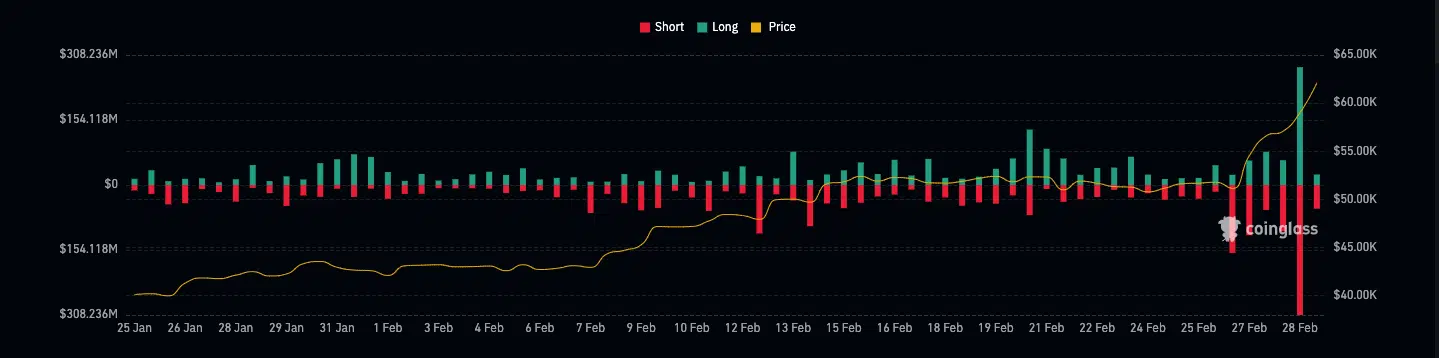
- Both short and long positions fell victim as BTC swung up and down.
- The Liquidation Heatmap showed that Bitcoin might face no hindrance in hitting $70,000.
If you held a short position in the market, there is a high chance you are part of 79,700 traders who have seen their funds wiped out in the last 24 hours. This happened because Bitcoin’s [BTC] price flipped past $64,000 on the 28th of February. Moments later, the price of the coin plunged below the $60,000 threshold.
From Coinglass data, AMBCrypto observed that the total amount of liquidation was over $790 million. Out of this, short positions accounted for $438 million while long liquidations were around $352 million.
The road beyond $69,000 may be here
Furthermore, the derivatives information portal revealed that Bitcoin liquidations were worth $298.98 million. Ethereum [ETH], whose price had surged above $3,300 registered $126.83 million in the wipeout.
For those unfamiliar, liquidation occurs when a trader’s leveraged position is automatically closed. This often occurs because the trader can no longer satisfy the margin requirements.
If Bitcoin’s price continues to increase, more positions could be liquidated. AMBCrypto checked the Liquidation Heatmap to ascertain the chance of a rise.
The Liquidation Heatmap could also show the possible prices where positions could face another round of wipeouts. According to our analysis using HyblockCapital’s data, Bitcoin’s price could rise to $75,000 within the next few weeks.
In addition, the indicator revealed no major resistance along that path. However, if Bitcoin hits $70,000, many short positions between $49,000 and $56,000 could face liquidation.
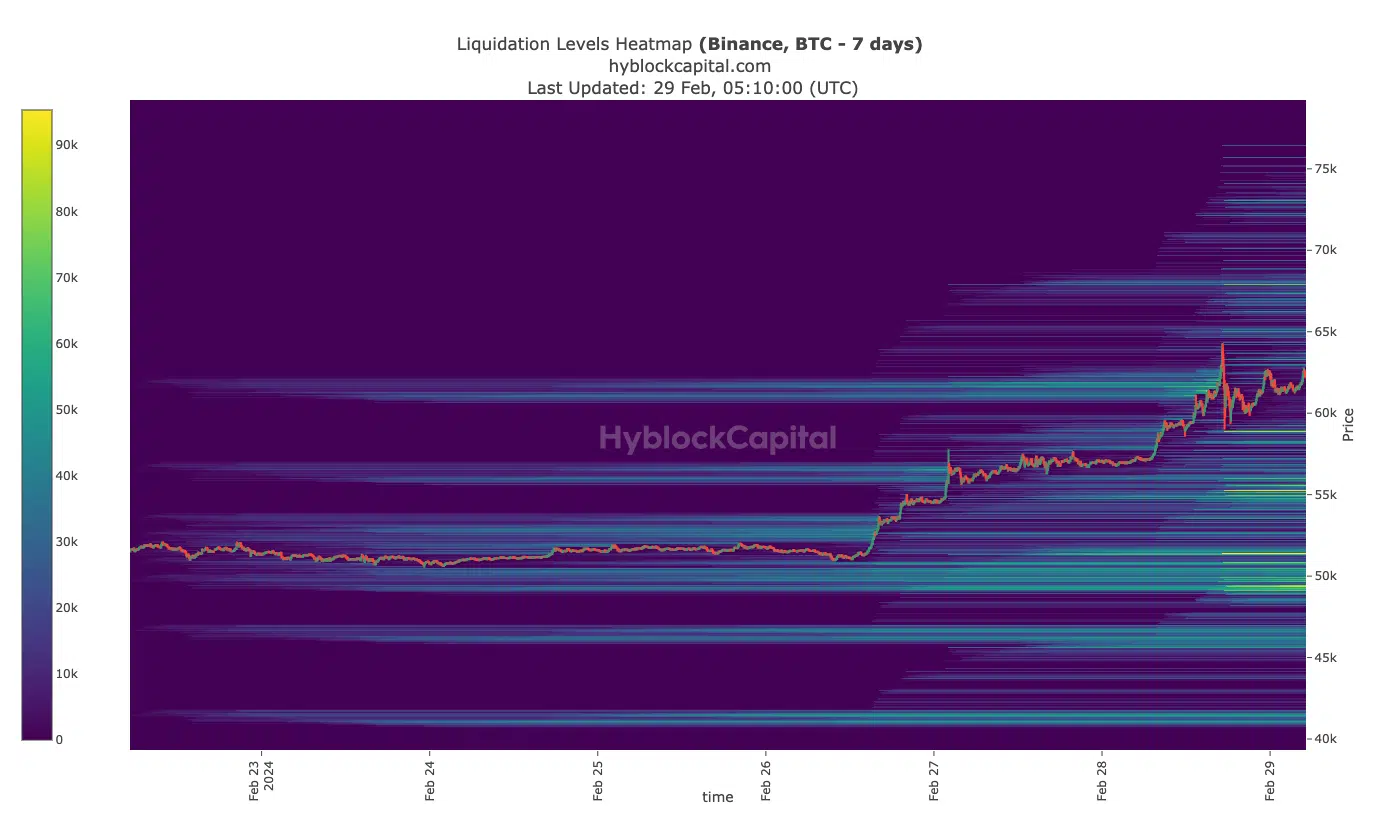
Source: HyblockCapital
Bears are almost non-existent
On the daily timeframe, bulls held on the solid support at $55,450. However, in the run to $64,000, Bitcoin experienced a minor resistance at $57,395. However, buying pressure helped in clearing the path.
AMBCrypto observed that BTC registered a 15.01% increase between the solid support and its rise to $61,837.
In terms of the price potential, the Directional Movement Index (DMI) projected a further increase for the coin. At press time, the +DMI (green) was 39.34. The -DMI (red), on the other hand, was 2.62.
The difference in the indicators was proof that bears have been pegged back and might have no chance of tugging BTC back.
Furthermore, the Average Directional Index (ADX) reading was 57.82. The ADX (yellow) shows if the direction movement is strong or weak.
If the ADX reading is less than 25, it suggests a weak directional movement. Therefore, the high ADX alongside Bitcoin’s rising price suggests that the coin might hit a higher value soon.
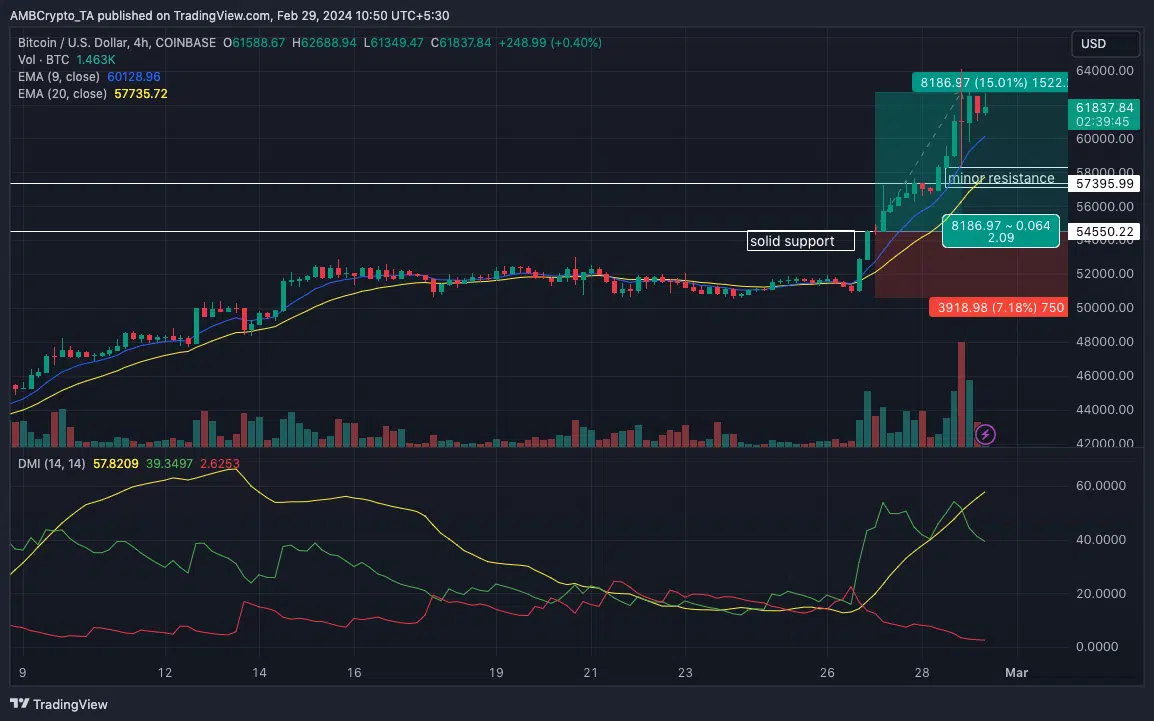
Source: TradingView
Read Bitcoin’s [BTC] Price Prediction 2024-2025
Should buying pressure continue like it has in the last few days, BTC could surpass the $69,000.
However, if bearish forces get a share of the market dominance, Bitcoin’s price could slide to $55,000. But in the current market condition, the indicators favor an upswing.