- Last week accounted for more than half of all AVAX tokens burned over the last 30 days.
- However, the spike failed to exert any upward pressure.
Avalanche’s [AVAX] burn rate spiked sharply in the last week, accelerating the rate at which native tokens were exiting circulation.
According to AMBCrypto’s analysis of Avascan data, around 31,650 AVAX coins went up in smoke over the last seven days, with more than half of this amount getting burned on the 24th of February alone.
The dramatic spike came after days of steadiness, where the daily burn rate hovered in the range of 1,000-1,300. Consequently, last week accounted for more than half of all tokens burned over the last 30 days.
High network activity accelerates burn rate
The jump in burn rate followed a similar spike in transactions on the network, AMBCrypto noticed, using data from Avalanche explorer.
As per the existing framework, Avalanche burns all the revenue it generates from transaction fees.
This meant that the higher the network activity, the higher the fees, and consequently, higher the amount of AVAX that would be burned.
Typically, burn activity is interpreted as a bullish event because of the supply squeeze that it brings about. However, last week’s spike failed to exert any upward pressure on AVAX.
The ninth-largest crypto was down 8.46% over the last week as of this writing, according to CoinMarketCap.
Derivatives market goes bearish in AVAX
AVAX’s price decline impacted speculative interest for the token. According to AMBCrypto’s scrutiny of Coinglass’ data, the Open Interest (OI) in AVAX Futures dropped 18% in the last 10 days.
In the same period, AVAX’s Longs/Shorts ratio failed to exceed 1, implying a clear dominance of bearish leveraged traders.
What do technical indicators say?
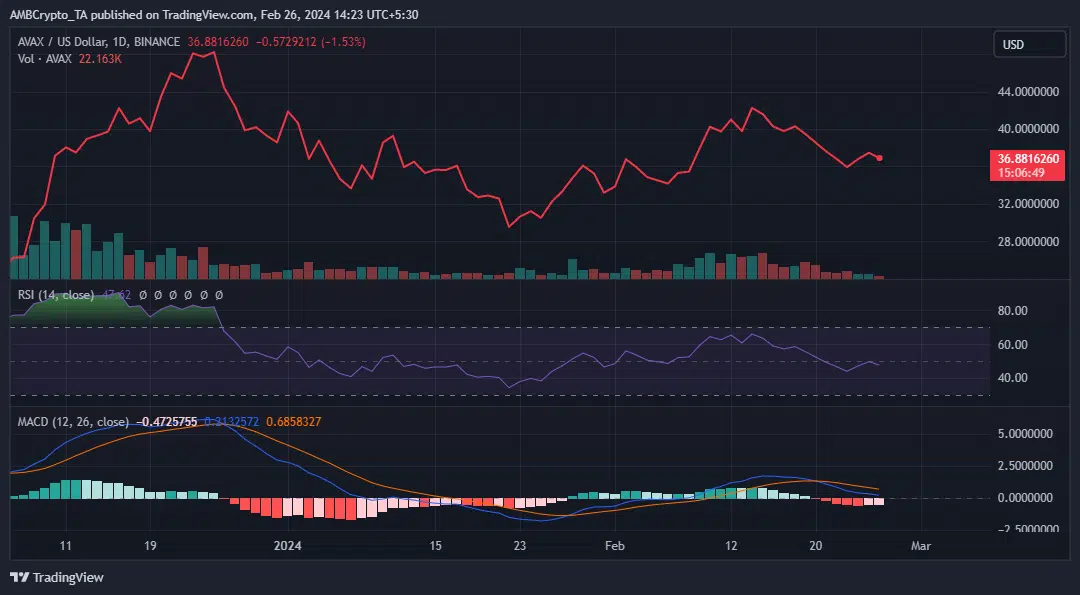
An examination of AVAX’s daily chart provided intriguing clues about its next moves.
The Relative Strength Index (RSI) tested the neutral 50 level as resistance and pulled back. A successful breaching of this level could inject some bullish vigor into AVAX in the days to come.
How much are 1,10,100 AVAXs worth today?
The Moving Average Convergence Divergence (MACD) line was below the signal line as of this writing, indicating a retracement.
However, a bullish crossover seemed plausible, after which AVAX could resume its uptrend.


Leave a Reply