- Investors are willing to hold LTC, indicating the price might get close to 2021’s peak.
- The Pi Cycle Top showed that LTC was not yet overheated.
Reaching $250 means Litecoin’s [LTC] price has to increase by more than 150% from its press time value. As of this writing, the coin changed hands at $80.61.
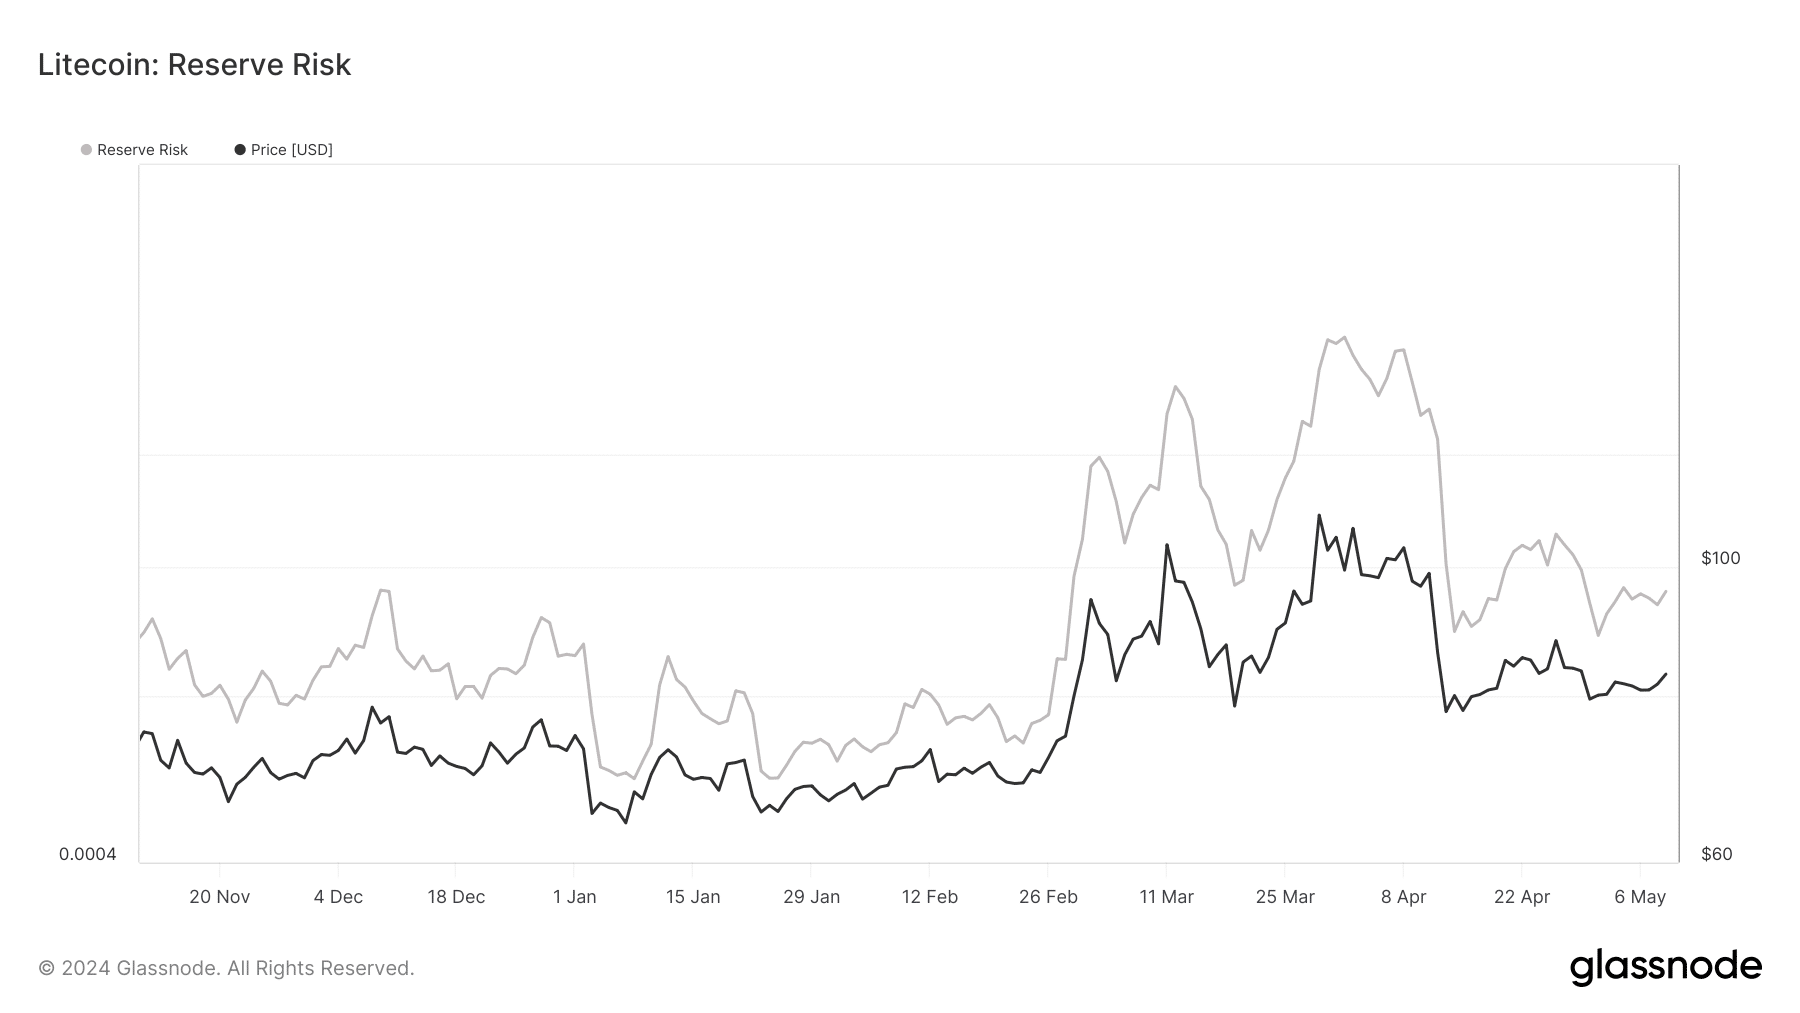
This value was a 15.60% correction in the last 30 days. However, AMBCrypto’s assessment of Litecoin’s Reserve Risk indicated that better days are coming.
Reserve Risk has an alias, called the “HODL bank.” For the uninitiated, HODL stands for Hold On to Dear Life. It describes a situation where cryptocurrency investors refrain from selling irrespective of the price movement.
The stakes are high
With the Reserve Risk, traders can tell if long-term holders are confident in the price or otherwise. If the price is high and confidence is low, it means that the risk-to-reward ratio might not be worth betting on.
However, a rising Reserve Risk and a low value indicate superb conviction in the long-term value of the coin, and this was the situation with Litecoin.


Source: Glassnode
From the look of things, this metric might continue to increase. If this is the case, the price of LTC might retest $100 again. However, breaking $100 would mean that the coin might rise by another 100%.
Should this be the case, a jump to $250 could be possible. The last time Litecoin changed hands at that price was in November 2021.
Since then, the value has been swinging lower. However, AMBCrypto found another metric supporting the price increase. This time, it was the Pi Cycle Top indicator.
LTC shows signs of expanding
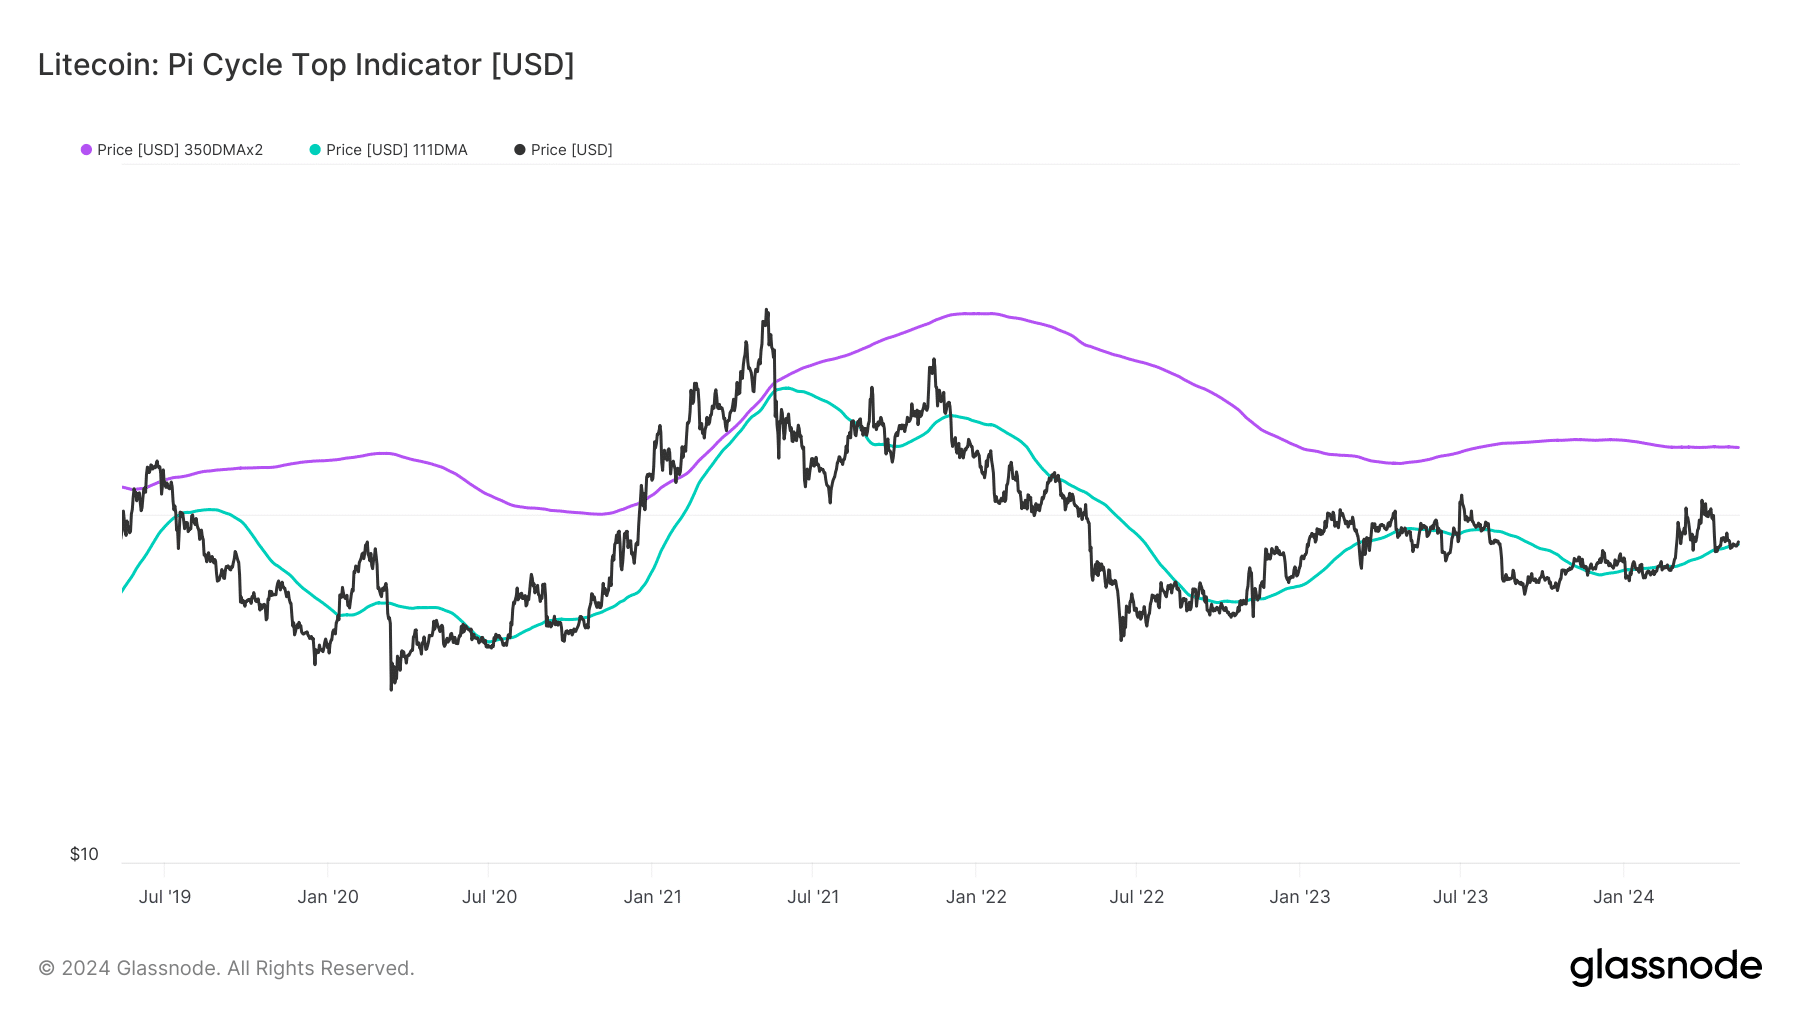
On this chart, you will find two lines, One green— representing the 111-day Simple Moving Average (SMA). Another one colored purple, which indicated the 350-day SMA.
Historically, prices hit the peak when the shorter SMA reached the same level as the larger SMA. Evidence of this showed in the last quarter of 2021 when Litecoin’s price dropped from $385 to $136 months later.
However, data at press time showed that the 111-day SMA was at a lower point when compared to the 350-day SMA. This indicates that LTC still has a lot of room to grow before the end of the bull market.


Source: Glassnode
While this might not be immediate, the position of this metric reinforces the prediction that Litecoin might rise to $200 or $250 in a matter of months.
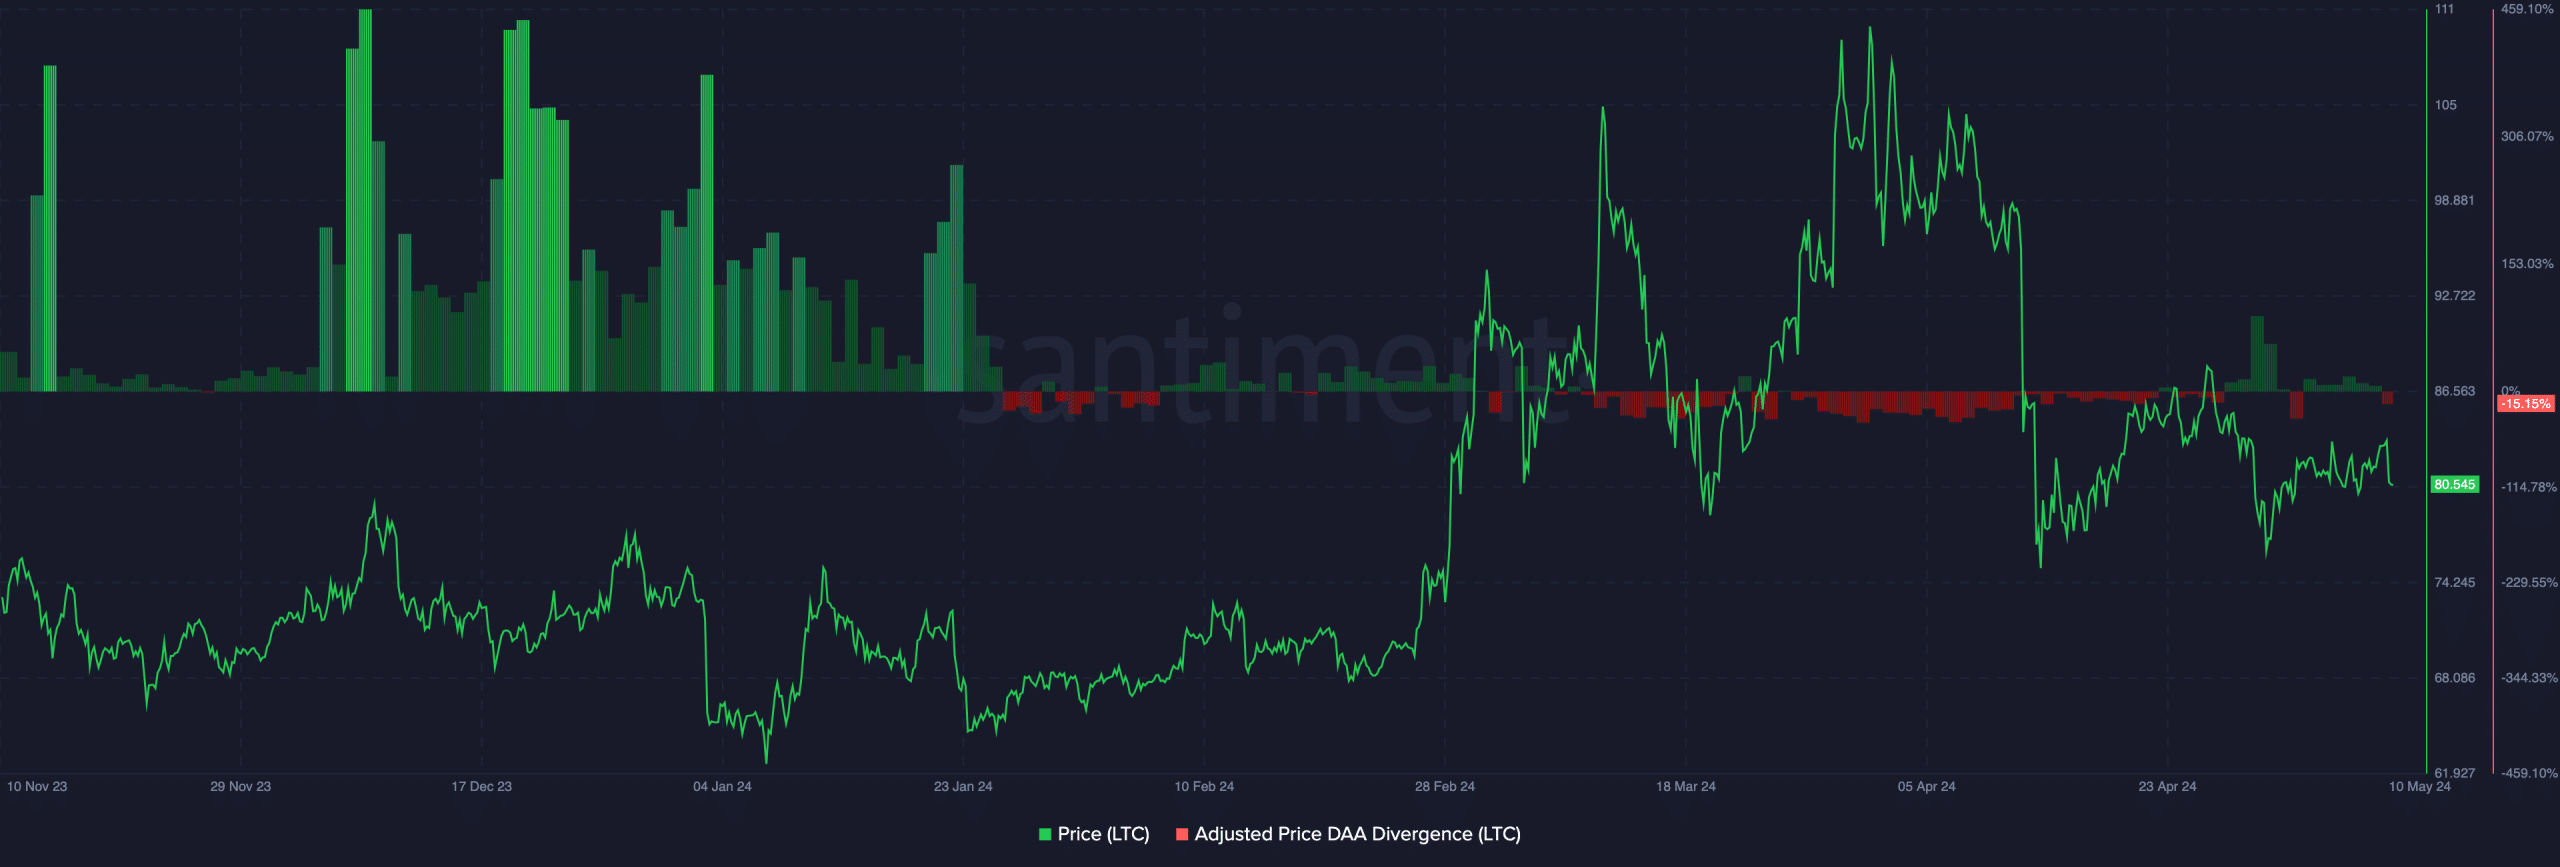
Meanwhile, the adjusted price-DAA divergence was -15.15%, according to data from Santiment. DAA is an acronym for Daily Active Addresses. It is the number of unique crypto addresses interacting with a network.
When the price is combined with DAA, traders can have an idea of entry and exit points. The negative reading of the price metric implied that Litecoin’s price grew more than the active addresses in recent times.


Source: Glassnode
Read Litecoin’s [LTC] Price Prediction 2024-2025
From a trading perspective, this is a buy signal. Hence, LTC might have provided a rare accumulation opportunity.
However, market participants might need to watch out for complementary metrics before doubling down on the entry price.


Leave a Reply