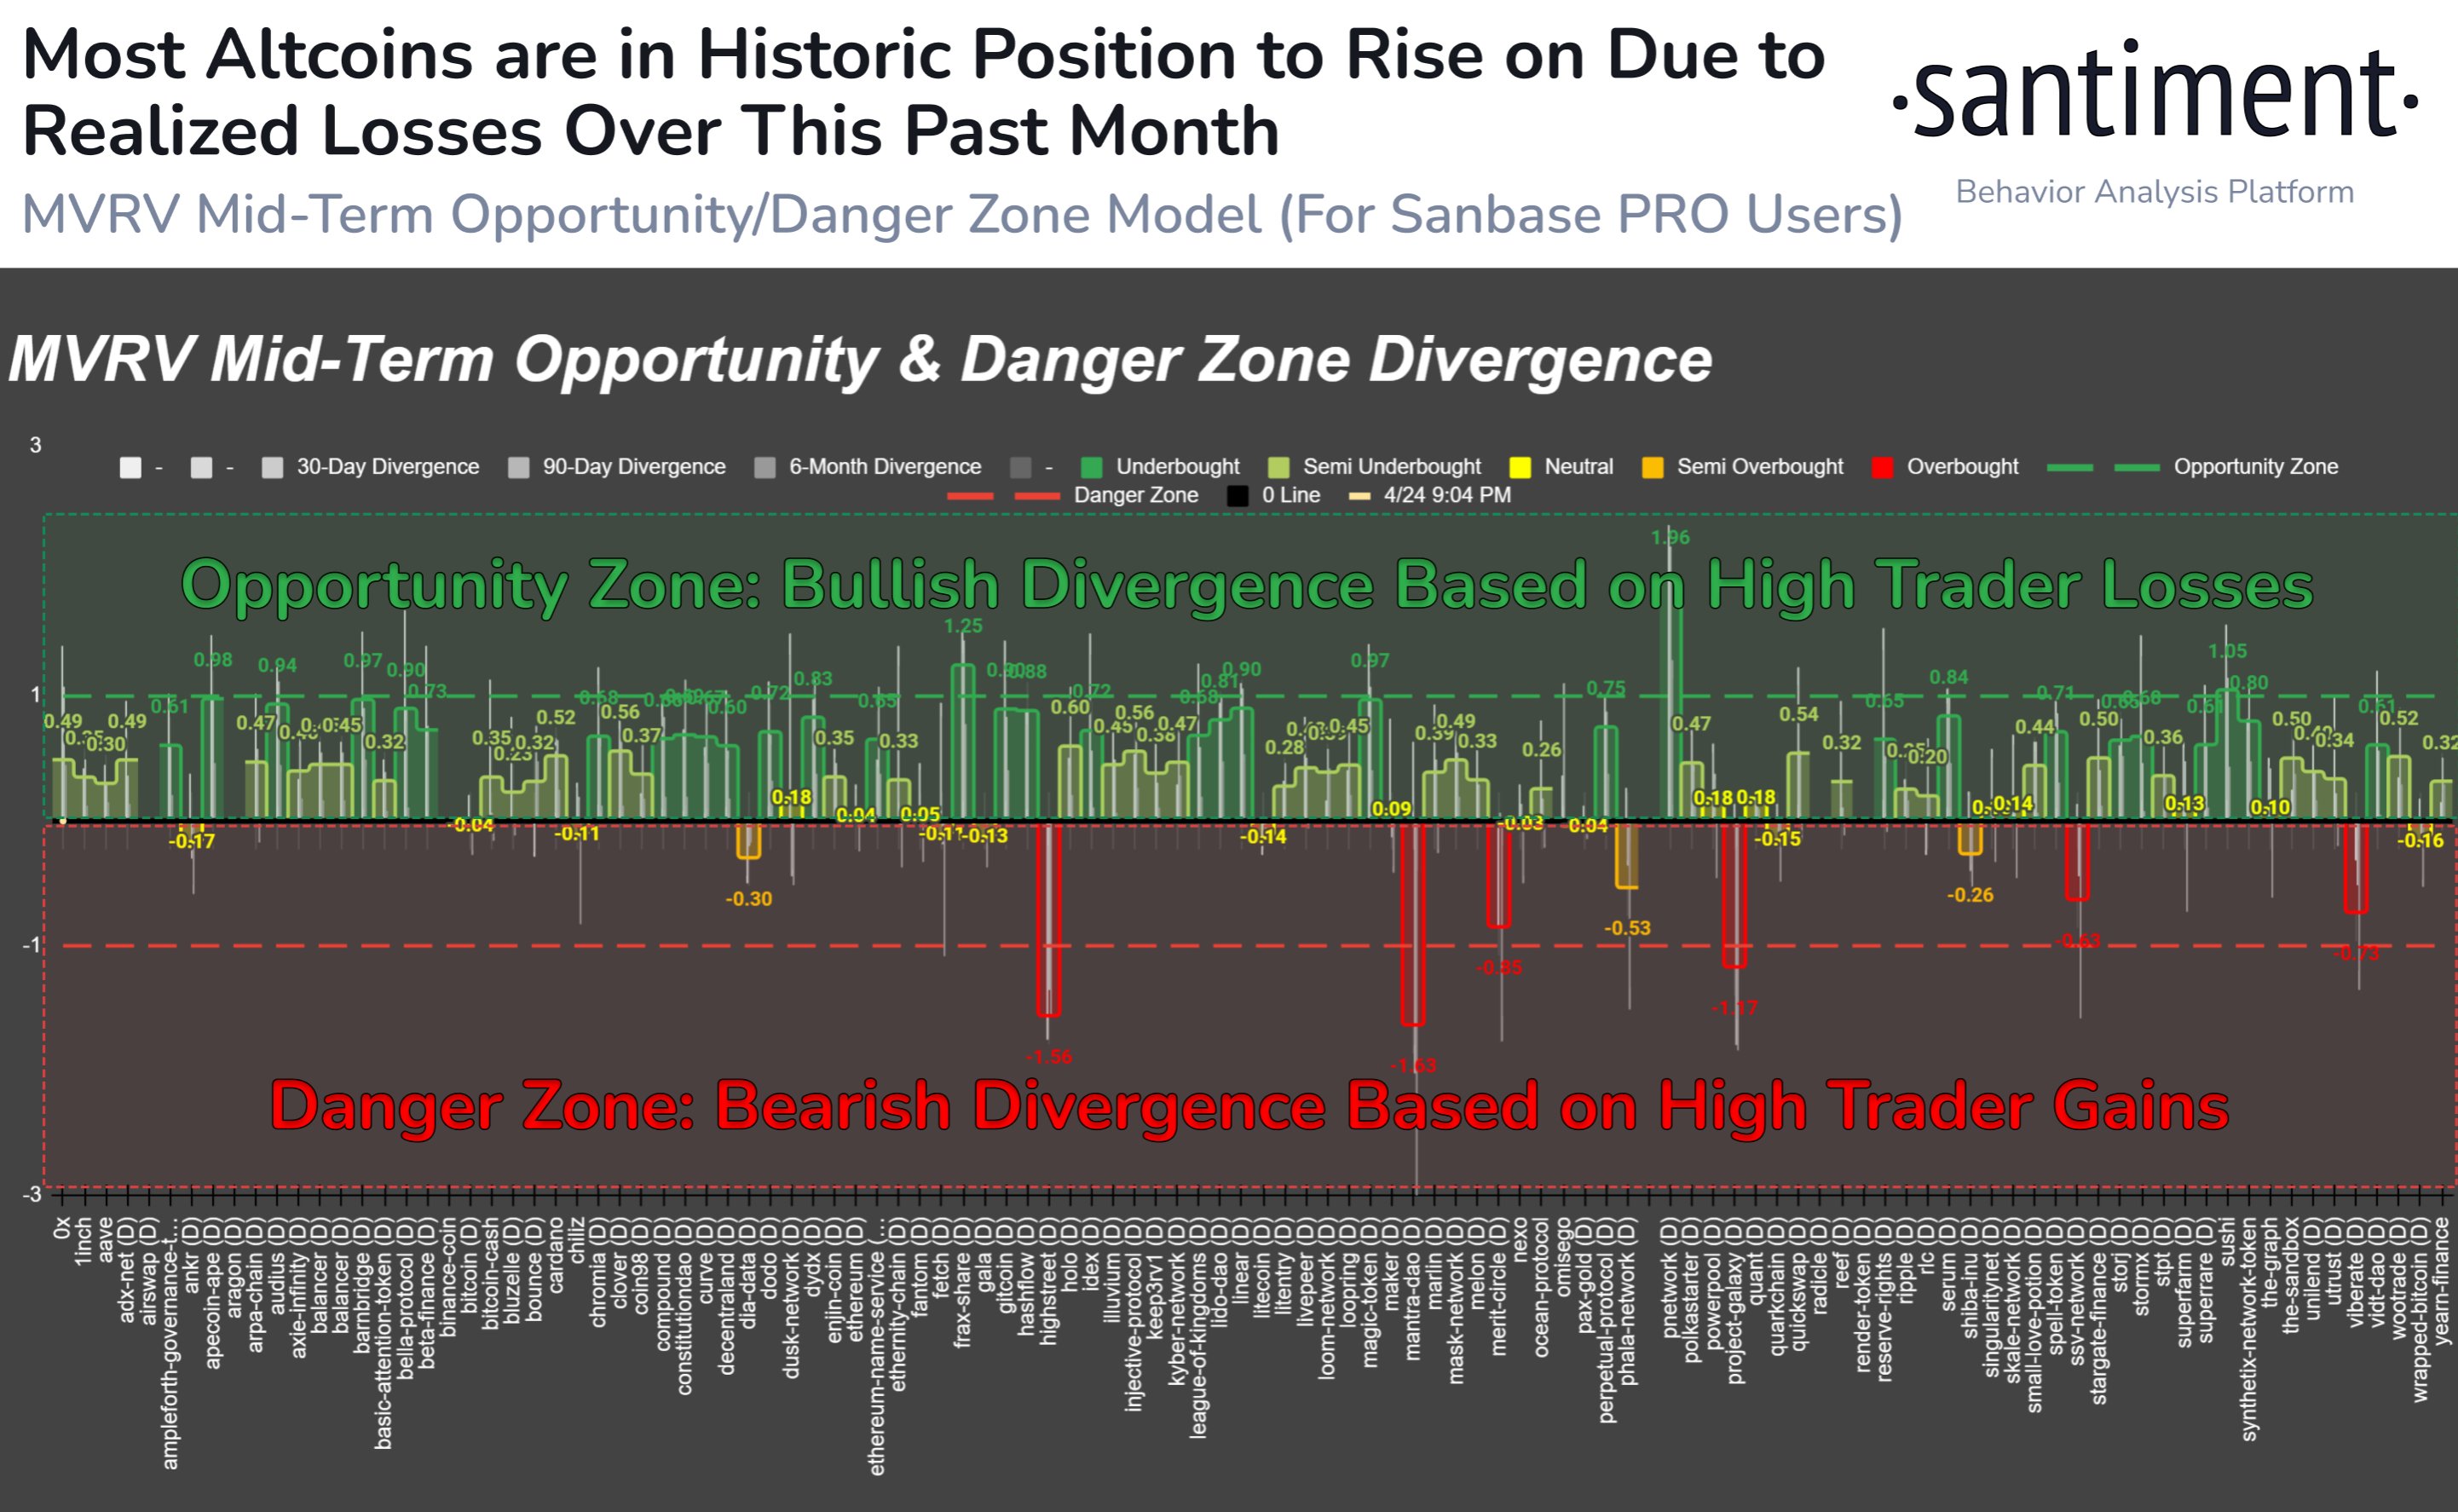
The on-chain analytics firm Santiment has revealed that over 85% of all altcoins in the sector are currently in the historical “opportunity zone.”
MVRV Would Suggest Most Altcoins Are Ready For A Bounce
In a new post on X, Santiment discussed how the altcoin market looks based on their MVRV ratio model. The “Market Value to Realized Value (MVRV) ratio” is a popular on-chain indicator that compares the market cap of Bitcoin against its realized cap.
The market cap here is the usual total valuation of the asset’s circulating supply based on the current spot price. At the same time, the latter is an on-chain capitalization model that calculates the asset’s value by assuming the “true” value of any coin in circulation is the last price at which it is transferred on the blockchain.
Given that the last transaction of any coin would have likely been the last time it changed hands, the price at its time would act as its current cost basis. As such, the realized cap essentially sums up the cost basis of every token in the circulating supply.
Therefore, one way to view the model is as a measure of the total amount of capital the investors have put into the asset. In contrast, the market cap measures the value holders are carrying.
Since the MVRV ratio compares these two models, its value can tell whether Bitcoin investors hold more or less than their total initial investment.
Historically, when investors have been in high profits, tops have become probable to form, as the risk of profit-taking can spike in such periods. On the other hand, a dominance of losses could lead to bottom formations as selling pressure runs out in the market.
Based on these facts, Santiment has defined an “opportunity” and “danger” zone model for altcoins. The chart below shows how the market currently looks from the perspective of this MVRV model.
The data for the MVRV divergence for the various altcoins | Source: Santiment on X
Under this model, when the MVRV divergence for any asset on some timeframe is higher than 1, the coin is considered to be inside the bullish opportunity zone. Similarly, if it is less than -1, it suggests it’s in the bearish danger zone.
The chart shows that MVRV divergence for a large part of the market is in the opportunity zone right now. As the analytics firm explains,
Over 85% of assets we track are in a historic opportunity zone when calculating the market value to realized value (MVRV) of wallets’ collective returns over 1-month, 3-month, and 6-month cycles.
Thus, if the model is to go by, now may be the time to go around altcoin shopping.
ETH Price
Ethereum, the largest among the altcoins, has observed a 3% surge over the past week, which has taken its price to $3,150.
Looks like the price of the asset has gone up over the last few days | Source: ETHUSD on TradingView
Featured image from Shutterstock.com, Santiment.net, chart from TradingView.com
Disclaimer: The article is provided for educational purposes only. It does not represent the opinions of NewsBTC on whether to buy, sell or hold any investments and naturally investing carries risks. You are advised to conduct your own research before making any investment decisions. Use information provided on this website entirely at your own risk.


Leave a Reply