
- More USDT borrowing than Bitcoin during price dips.
- Liquidation heatmap showing the way for BTC is up.
Bitcoin [BTC] has seemingly found a local bottom near the midpoint of the downward trend channel it has followed for the past seven months.
After briefly touching $66K, BTC began correcting, leading many traders to speculate that Q4 could bring bullish momentum to the broader cryptocurrency market.
One interesting metric supporting this sentiment is the shift from borrowing BTC during price pumps to borrowing USDT during price dips.
Traders are increasingly borrowing USDT to “buy the dip” and increase their exposure to Bitcoin, which is a positive indicator for the upcoming quarter.
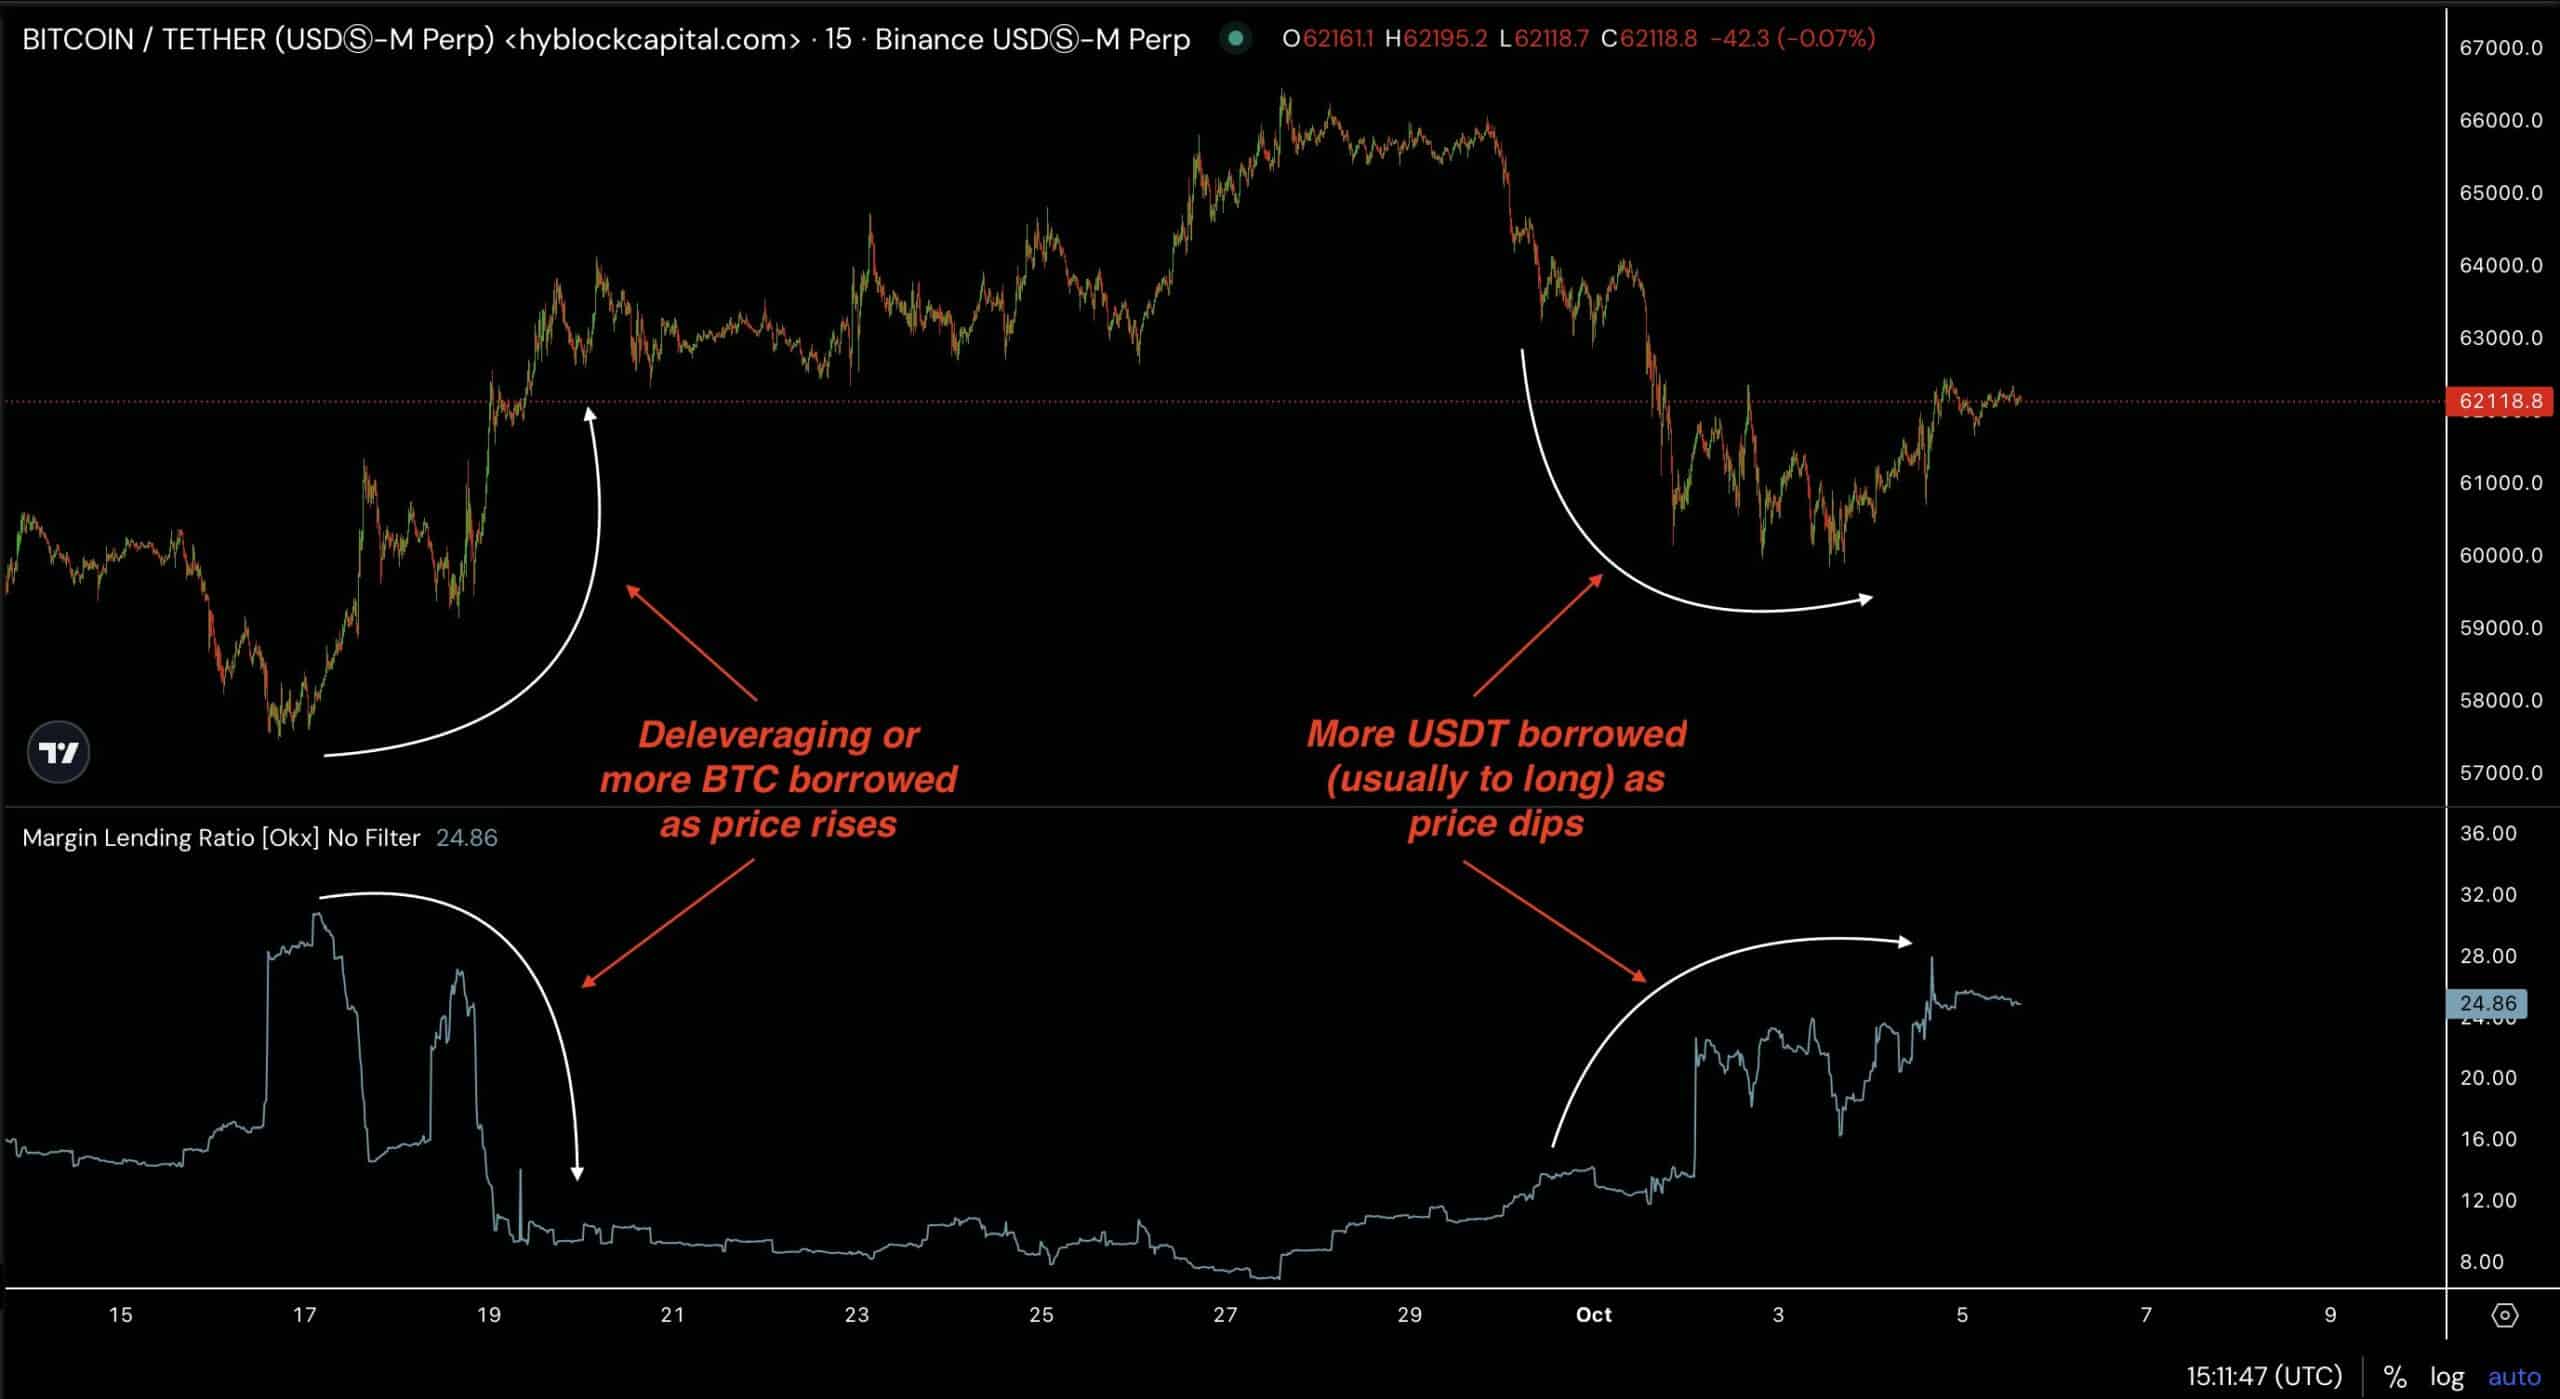
Source: Hyblock Capital
Bitcoin breaking market structure
The current price action of Bitcoin further supports this bullish outlook. After breaking the market structure of the BTC/USD pair, the price dropped to establish a higher low following significant long liquidations.
This local bottom now sets the stage for a potential move upward. To maintain the bullish trend, BTC needs to break above the Daily 200 Moving Average (200MA) and surpass last week’s highs.
If Bitcoin can push through these resistance levels, the $70K level will become the next critical target, signaling stronger bullish momentum as Q4 progresses.
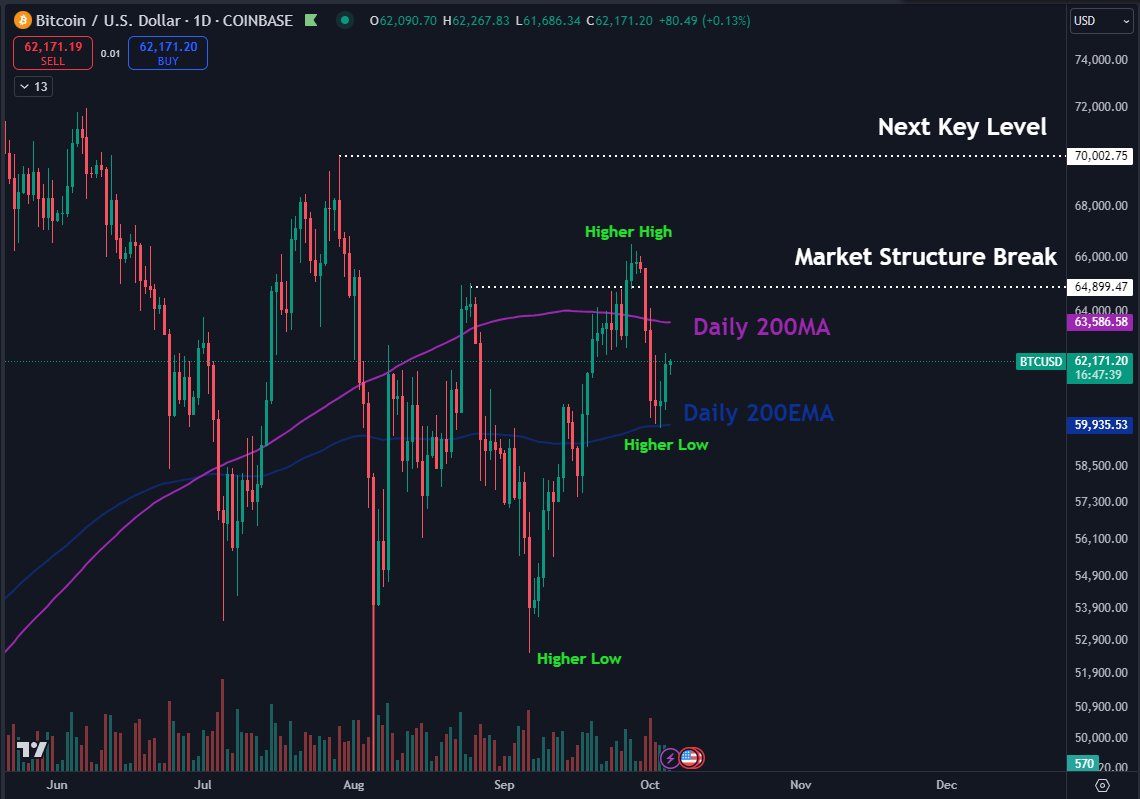
Source: TradingView
Short-Term Holder MVRV and SOPR retesting
Additional metrics like the Bitcoin Short-Term Holder MVRV and SOPR also point to positive outcomes.
Both metrics are retesting their neutral “1” line, indicating that if they bounce from this position, it will confirm a more bullish outlook for BTC.
This is a critical moment for short-term speculators, as a bounce here would further fuel price appreciation, potentially rewarding both short-term traders and long-term holders.
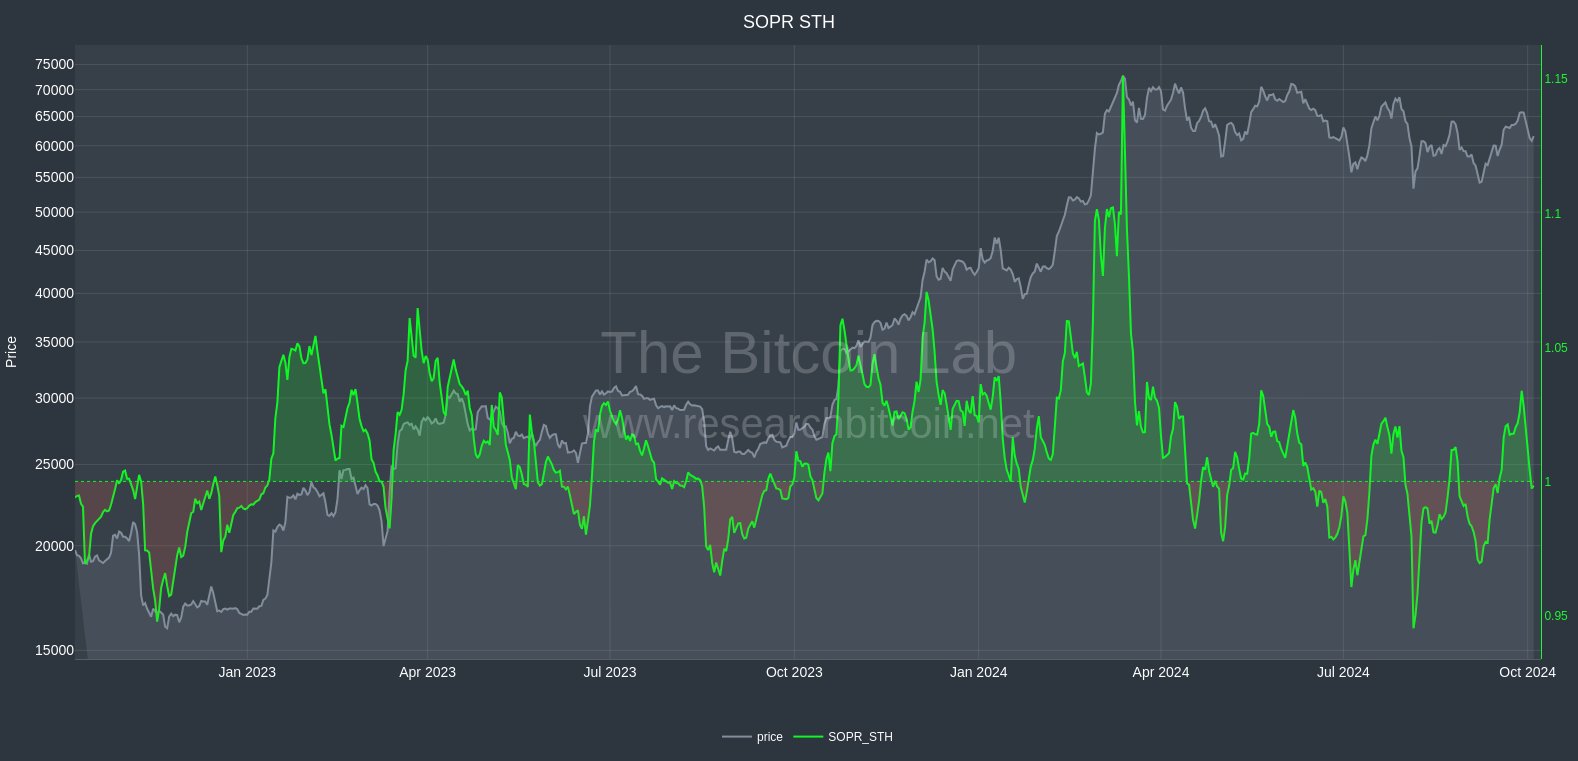
Source: The Bitcoin Lab
Such a scenario would increase the likelihood of BTC reaching new highs before the end of the year.
Massive liquidity resting above
Furthermore, the Bitcoin liquidation heatmap reveals that a significant amount of liquidity now sits above the current price level.
Since price movements often gravitate toward areas of high liquidity, this suggests that BTC is poised for upward movement.
The most substantial liquidity zone lies between $63K and $66K, meaning Bitcoin could experience a “short squeeze” if upward momentum gains traction in the coming days.
While there is some liquidity below $60K, it is not as concentrated, indicating that the path of least resistance is upward.
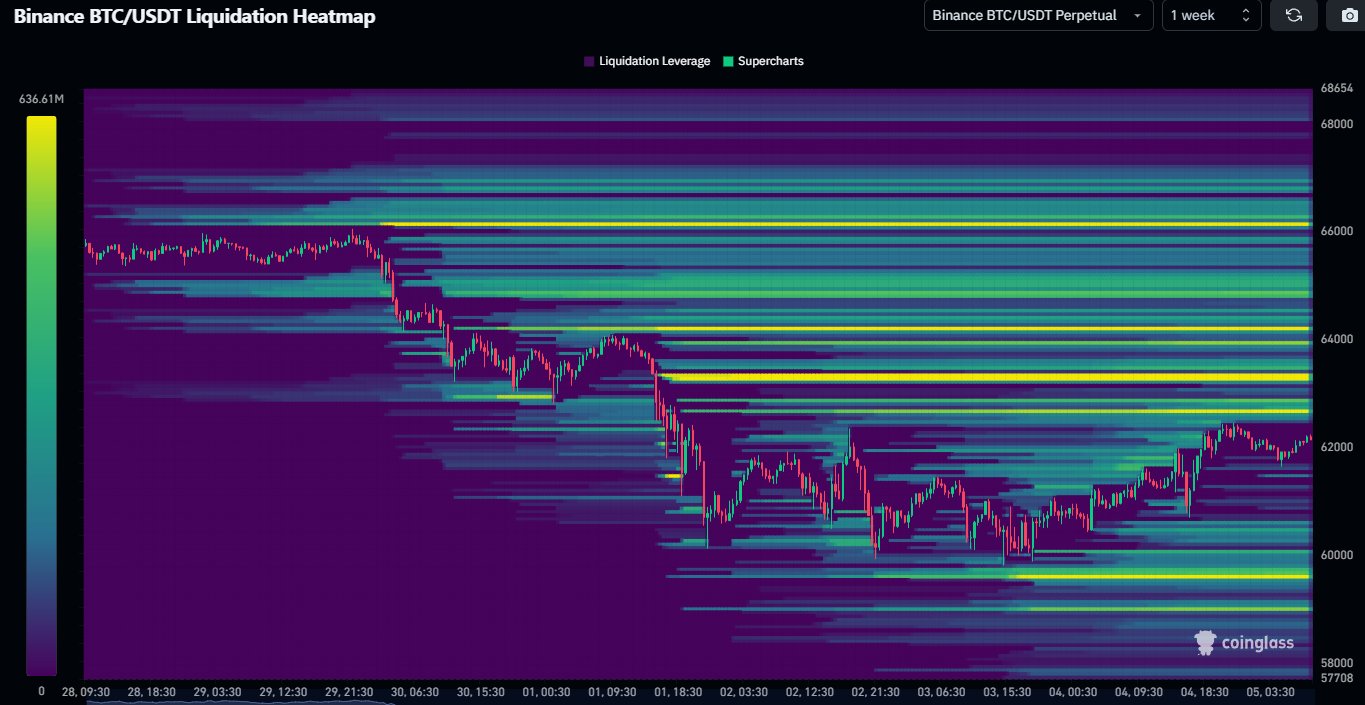
Source: Coinglass
Read Bitcoin’s [BTC] Price Prediction 2024–2025
Bitcoin appears to be well-positioned for potential gains as Q4 progresses. Metrics such as increased USDT borrowing, the establishment of a local bottom, and the liquidity heatmap all point to a bullish outlook.
With the $70K level in sight, BTC may be gearing up for a strong finish to the year, rewarding traders who have positioned themselves for the next leg up.