
Amid ongoing price correction across the crypto market, Chainlink (LINK) has recently experienced a breakout of bullish price action patterns and is now poised for a significant rally. Despite LINK’s bullish outlook, major cryptocurrencies including Bitcoin (BTC), Ethereum (ETH), and Solana (SOL) are struggling to gain momentum.
Chainlink (LINK) Technical Analysis and Upcoming Levels
According to expert technical analysis, LINK appears bullish and as of September 28, 2024, it broke out from the bullish double-bottom price action pattern. In trading, this pattern is considered a bullish signal, and traders often prefer going long following the breakout.
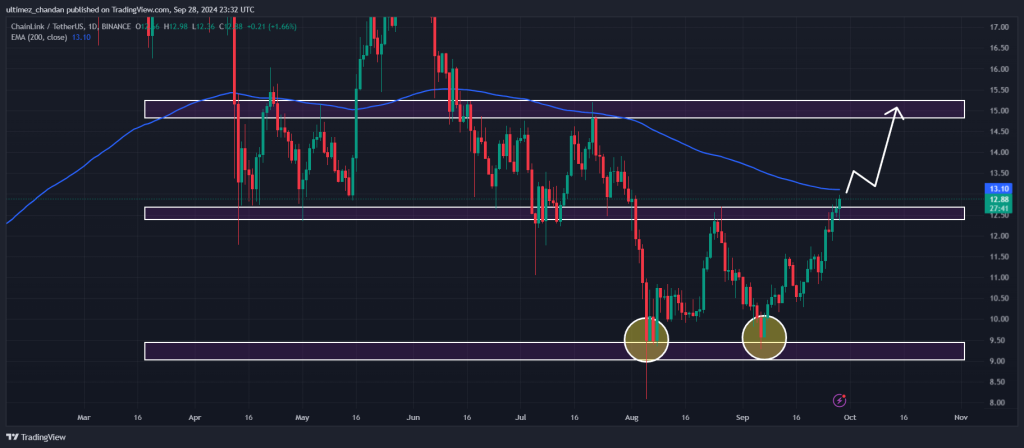
Based on the historical price momentum, if LINK closes its daily candle above the $12.90 level, there is a strong possibility that it could soar by 15% to reach the $15 level in the coming days.
Bullish On-Chain Metrics
This positive outlook for LINK is further supported by on-chain metrics. According to the on-chain analytics firm Coinglass, LINK’s Long/Short ratio currently stands at 1.031, indicating bullish sentiment among traders. Additionally, its future open interest has increased by 2.5%, indicating rising interest from traders following the bullish breakout.
Currently, 51.02% of top traders hold long positions, while 48.98% hold short positions.
Data from IntoTheBlock shows that the number of large LINK transactions has steadily increased along with the LINK price in the past 7 days, indicating increased whale activity.
LINK Current Price Momentum
At press time, LINK is trading near $12.93 and has experienced a price surge of over 1.75% in the past 24 hours. Meanwhile, its trading volume has declined by 18% during the same time frame, indicating lower participation from traders and investors amid price correction.
This bullish thesis will only hold if LINK closes its daily candle above the $12.90 level, otherwise, it may fail.