

Over the last 30 days, Bitcoin has surged nearly 10.0%. The market appears extremely bullish right now. Since October 11, it has climbed consistently. Interestingly, since October 11, the Bitcoin Spot ETF market has experienced consistent positive net inflows. Meanwhile, key technical indicators point to a potential “golden cross”. Let’s analyze the major developments to get the right picture of the BTC market. Ready?
Bitcoin’s Recent Price Surge
At the start of October, BTC was at $60,818.09. The next day, it fell even further to a low of $60,648.15. During the period between October 2 and 10, the market majorly showed sideways movement. With the help of the buying pressure gained on October 10, the market broke above the sideways pattern.
During the period between October 11 and 18, the Bitcoin market demonstrated steep growth, marking a 13.41% rise. At present, the BTC market stands at the price of $68,400. So far, the market has achieved a growth of at least 12.46% this month. Doesn’t it look comfortably bullish? It does!
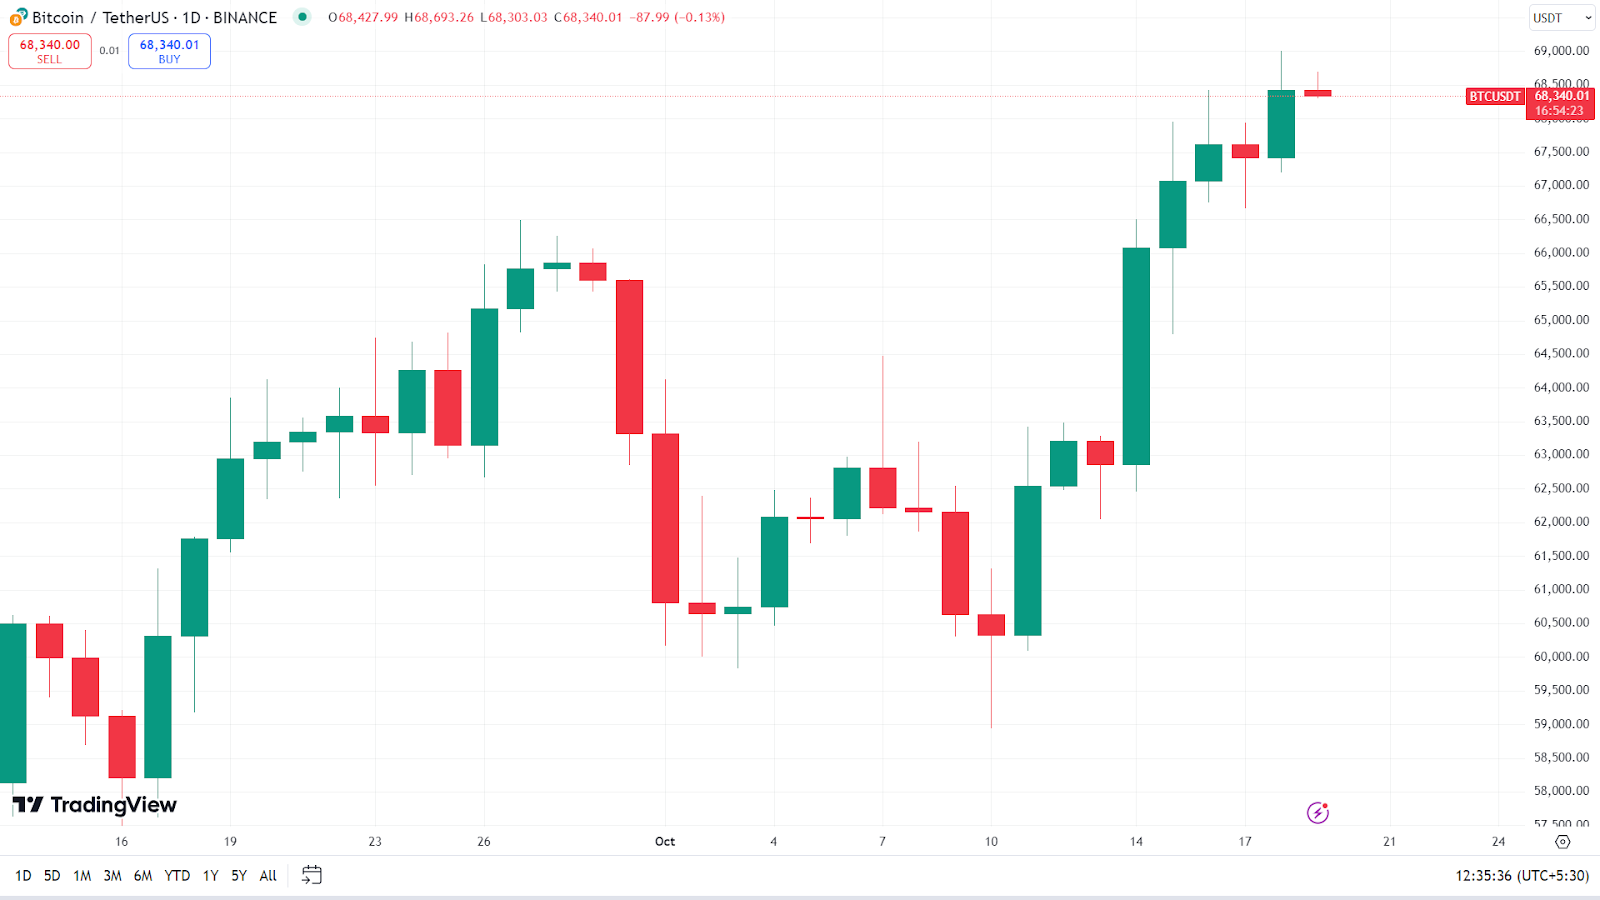
Interestingly, many experts link this growth to the consistent positive net inflow the Spot BTC ETF market has achieved since the day Bitcoin met its latest upward momentum (October 11).
Spot Bitcoin ETFs: Is It the Driving Force Behind the Current BTC Surge?
Since October 11, the Bitcoin spot ETF market has seen no negative next inflow. On October 11, the total Bitcoin Spot ETF Net Inflow was +253.60M – the lowest in the series of six consecutive positive inflows since that day. The highest Net Inflow of +555.90M was recorded on October 14. Yesterday, the market reported a positive net inflow of +273.70M -the second lowest. On the day the Bitcoin Spot ETF market recorded the week’s highest inflow, the price of BTC jumped sharply by around 5.13%.
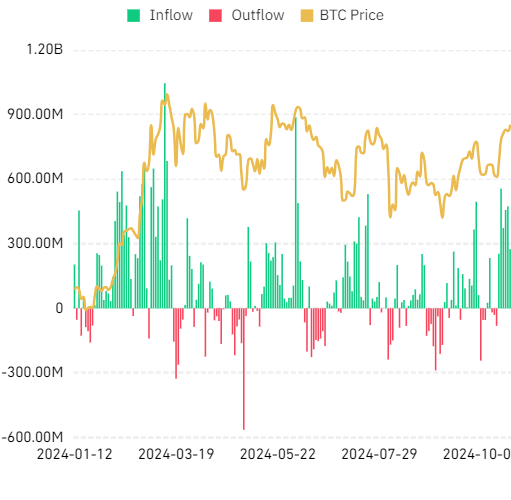
Though it cannot be considered the sole reason, there is nothing wrong in suggesting that the consistent positive net inflows in the BTC Spot ETF could be one of the reasons for the surge in the BTC price.
- Also Read :
- Why Is the Crypto Market Up Today?
- ,
Bitcoin Active Addresses: A Technical Analysis
The Bitcoin active addresses chart shows that a rise in active BTC addresses has happened recently. A rise in active Bitcoin addresses generally indicates an increase in interest in Bitcoin trading.
When we apply a 30-day moving average and a 365-day moving average to the chart, what we observe is a potential ‘golden cross’ – the possibility of the 30 DMA crossing above the 365 DMA. A golden cross is generally seen as a signal for a positive market momentum shift.
With BTC’s price climbing consistently and key technical signals pointing to further momentum, the market may be poised for tremendous growth.