

- Bitcoin has a bullish structure but failed to follow through on the breakout.
- Fears of a local top due to social media buzz played out in the past four days.
Bitcoin [BTC] achieved a breakout from a descending channel it has traded within since July. However, after reaching the local high of $66.5k, the price began to reverse its upward momentum.
In a post on X, crypto market intelligence platform Santiment noted that the crowd sentiment was particularly bullish. This raised the chances of a market top and panic selling should BTC prices dive lower.
The near 5% price drop on Monday vindicated this idea. Is the market ready to recover, or was that the local top?
Bitcoin Fear and Greed Index
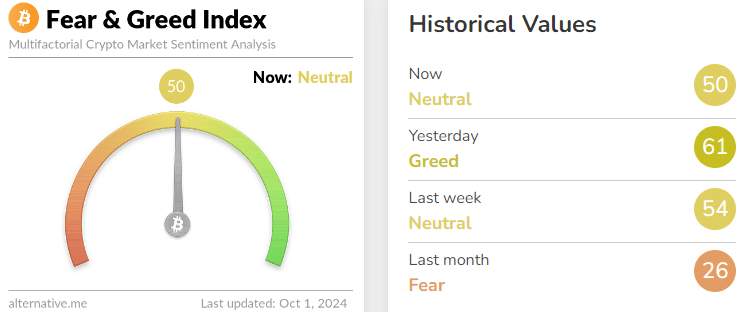
A look at the fear and greed index showed that market participants need not panic. The current sentiment was neutral and has been neutral or fearful in recent weeks.
The score is calculated using different data points such as volatility, market volume, social media engagement, and the Bitcoin dominance trends and Google Trends scores.
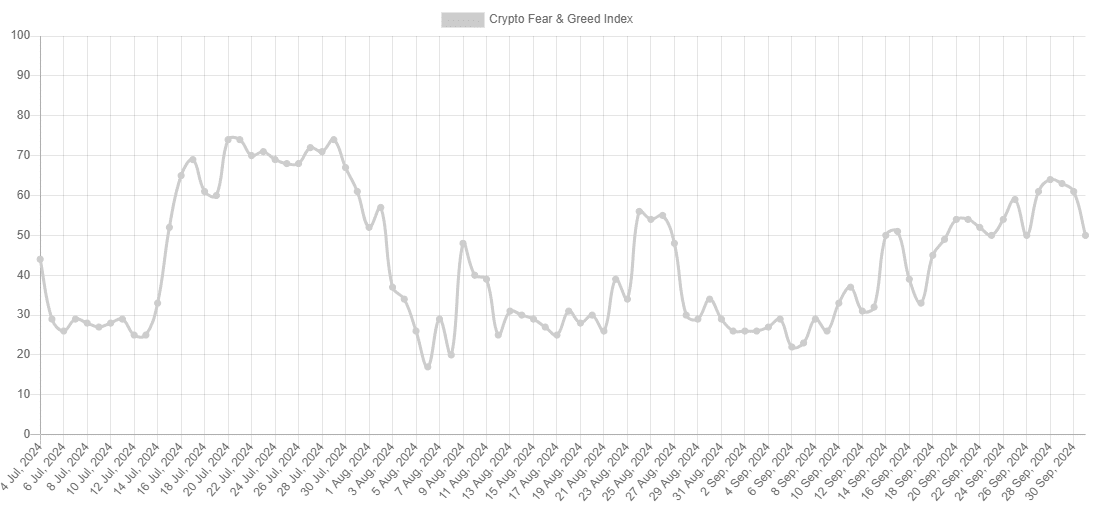
AMBCrypto also analyzed the Bitcoin Fear and Greed Index’s scores over the past three months. The price trend of September, especially the latter half, saw the index rise higher.
This was still not enough to push the market into “greedy” territory.
The failed channel breakout
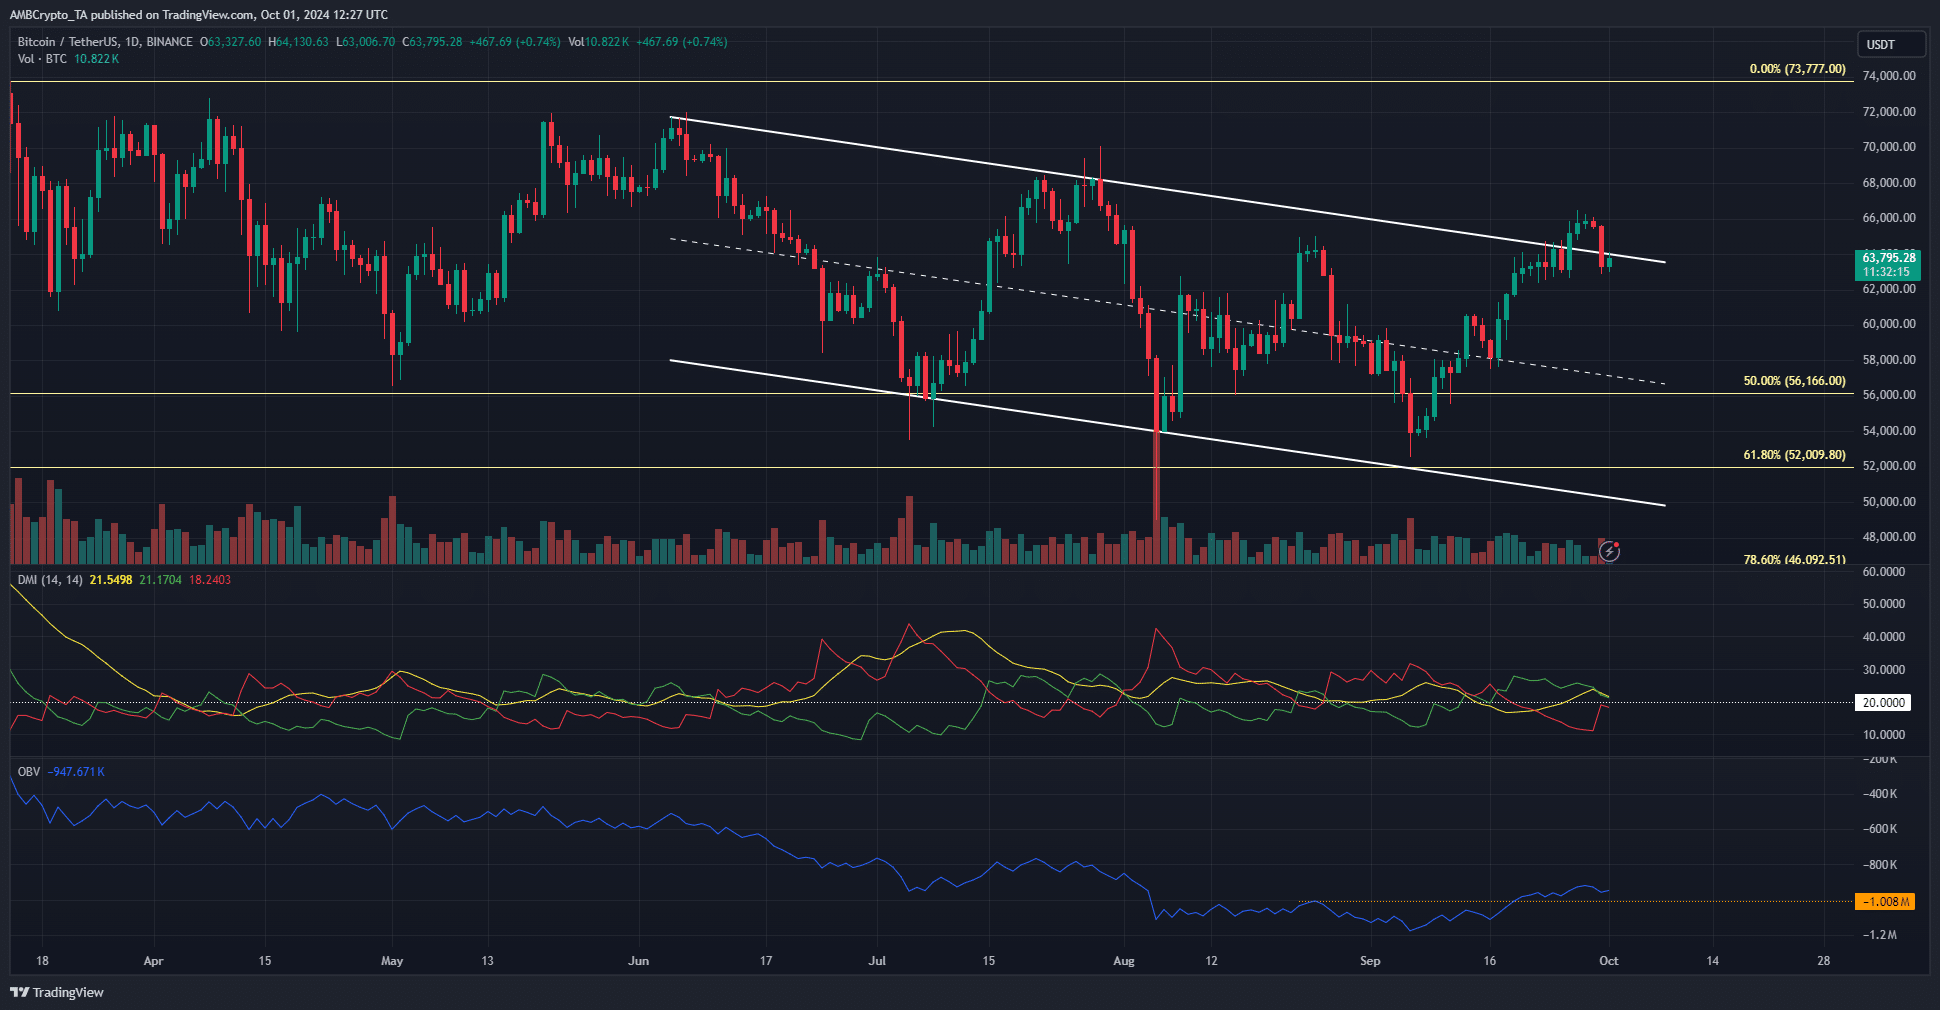
Source: BTC/USDT on TradingView
The price action since June has been characterized by a series of lower highs and lower lows. The most recent lower high at $65k from the 25th of August was breached, as were the descending channel’s highs.
This breakout did not last long. Within four days, BTC saw a 4.7% correction to fall back into the range and below the $64k-$66k resistance zone.
Read Bitcoin’s [BTC] Price Prediction 2024-25
The OBV has cleared the local high from August, but not by a substantial margin. A failure to follow through from the price meant that bulls lacked conviction in the short term and were more comfortable taking profits.
The DMI had signaled a strong uptrend during the breakout. The +DI and ADX were both above 20, and they still are, but were falling lower. It is likely that the $60k-$61.5k support zone next.
Disclaimer: The information presented does not constitute financial, investment, trading, or other types of advice and is solely the writer’s opinion