- Bitcoin stabilizes above $64,000, with metrics suggesting potential bullish momentum and ETF demand driving support.
- Analysts predict possible breakout targets between $88,000 and $100,000 if key resistance levels are reclaimed.
Bitcoin [BTC] has recently shown signs of stabilization above the $64,000 mark, although it initially surged to $66,000 in the early hours of the 30th of September.
Since then, a correction has brought the asset down to $64,633, marking a slight 1.4% decline.
Despite this short-term dip, a broader view reveals Bitcoin’s growth, with the asset up by 10.2% over the past two weeks.
However, the question remains: when will Bitcoin start the bull run that many experts predict could push its price into six figures?
To provide clarity for investors, CryptoQuant, an on-chain data provider, has shared critical metrics for tracking Bitcoin’s bullish momentum.
The platform published a series of posts on X (formerly Twitter) aimed at helping investors understand where Bitcoin might be headed.
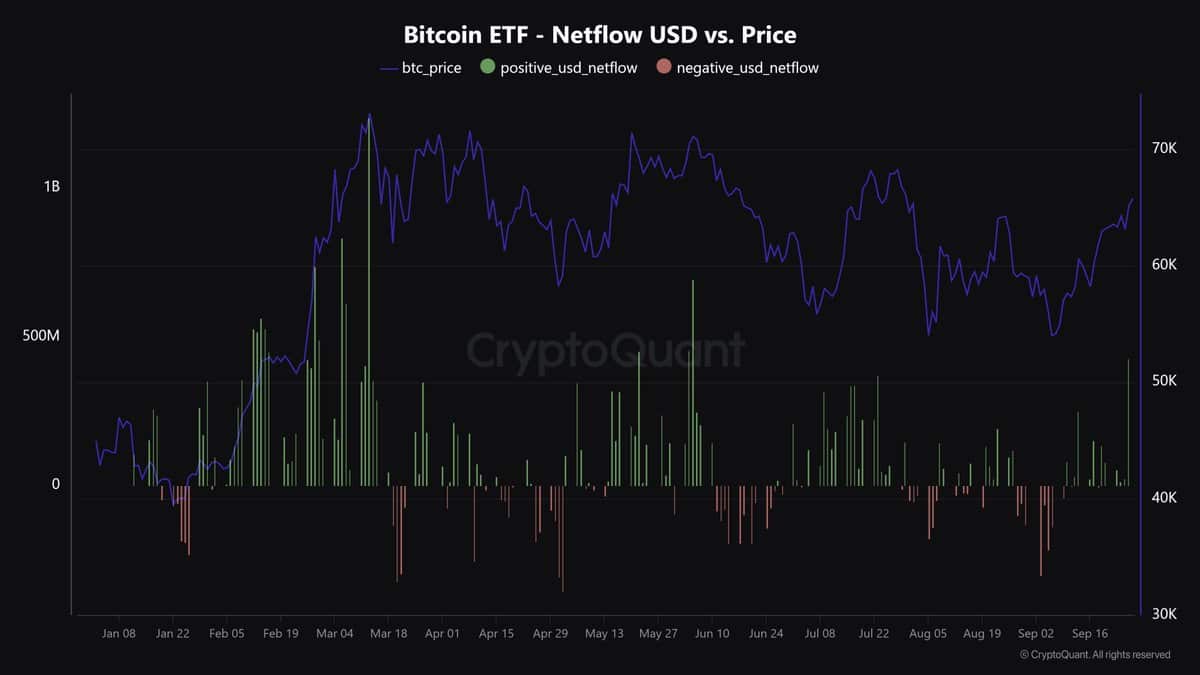
They noted that Bitcoin’s strong momentum over the past three weeks—rising over 23% from $52,500 to above $65,000—has been partly fueled by increased demand for spot Bitcoin Exchange-Traded Funds (ETFs).
Notably, combined inflows from BlackRock, Fidelity, and Ark totaled $324 million on the 26th of September, signaling heightened interest from U.S. investors.

Source: CryptoQuant
THIS is key for bullish momentum
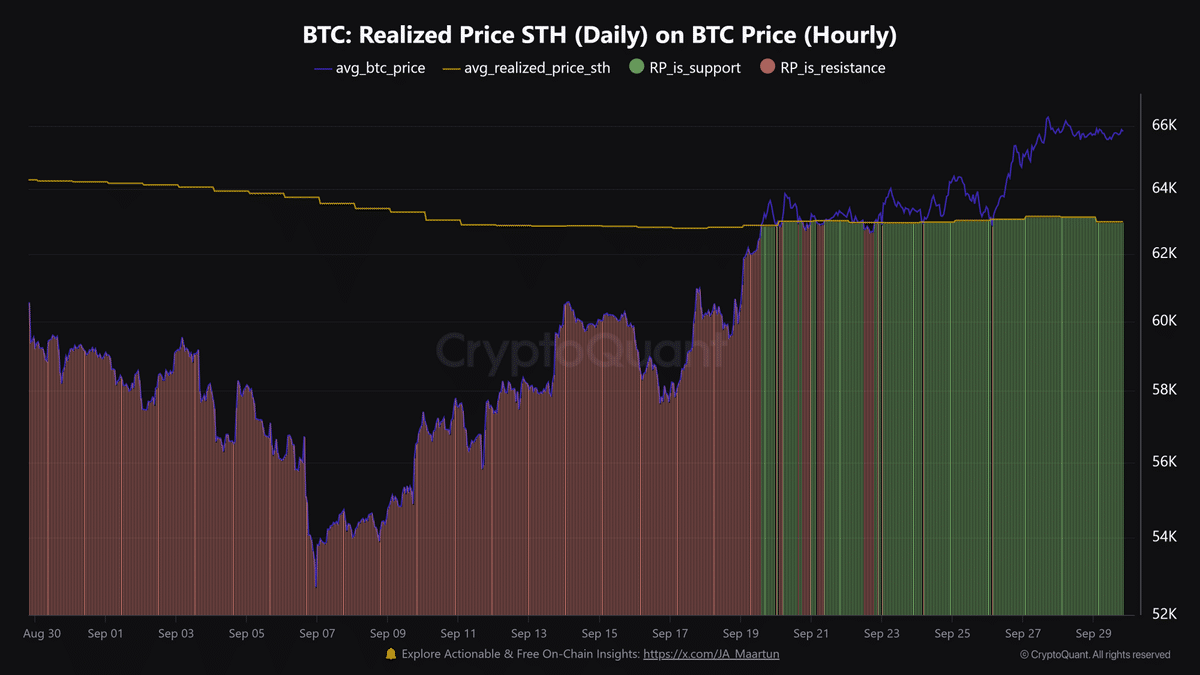
According to CryptoQuant, one of the key drivers for Bitcoin’s recent rally is the resurgence of short-term holders back into profit territory.
These holders, defined as investors who have moved their Bitcoin within the last 155 days, have an average purchase price of around $63,000.
As Bitcoin’s price hovers above this level, it could act as a strong support level, reinforcing bullish sentiment.

Source: CryptoQuant
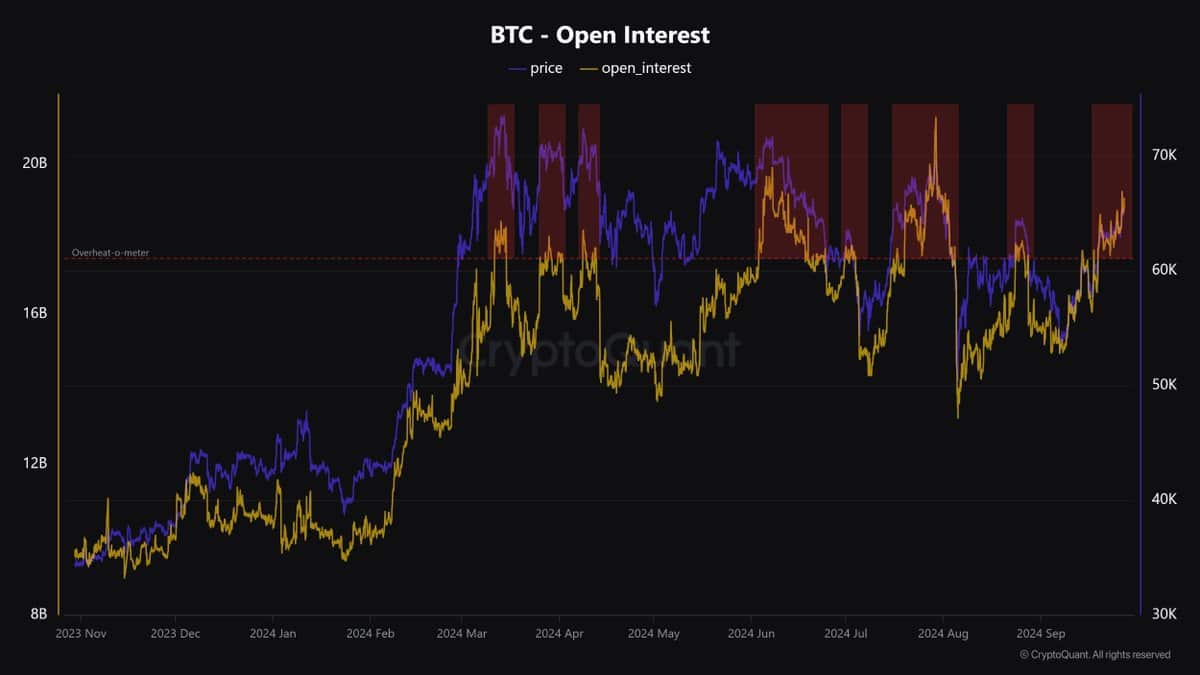
The futures market also offers significant insights into Bitcoin’s price trends. CryptoQuant revealed that Bitcoin’s Open Interest was $19.1 billion at press time.
Historically, surges past $18.0 billion have led to price corrections.

Source: CryptoQuant
This marks the seventh time such a threshold has been crossed since March 2024, prompting caution around the possibility of a short-term dip.
Despite this, the overall trend of increasing futures activity reflects growing investor confidence.
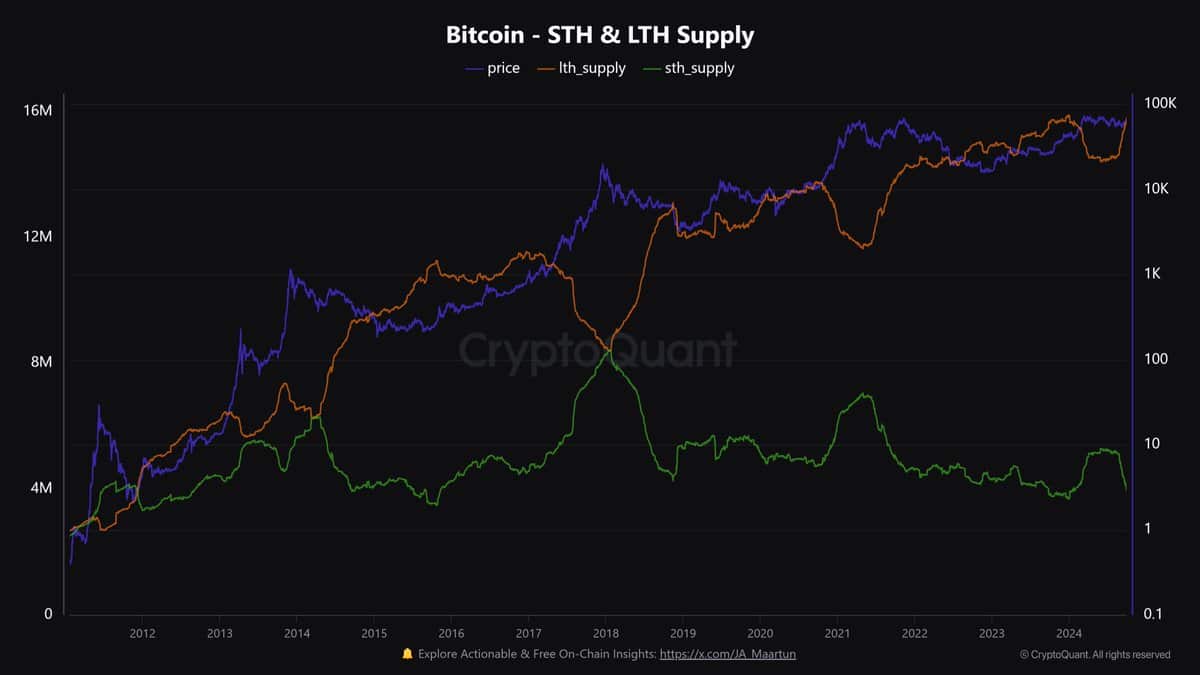
Another notable development is the transformation of spot Bitcoin ETF holdings into long-term holder supply.
As coins surpass the 155-day holding period, they are increasingly categorized as part of the long-term supply.

Source: CryptoQuant
While this shift might suggest a bullish outlook, CryptoQuant warns that such movements are often observed in the later stages of a bull market, indicating potential market maturity or a transition phase in Bitcoin’s trajectory.
Analysts weigh in on Bitcoin’s potential rally
Beyond the fundamental metrics, several analysts have shared their perspectives on where Bitcoin could head next.
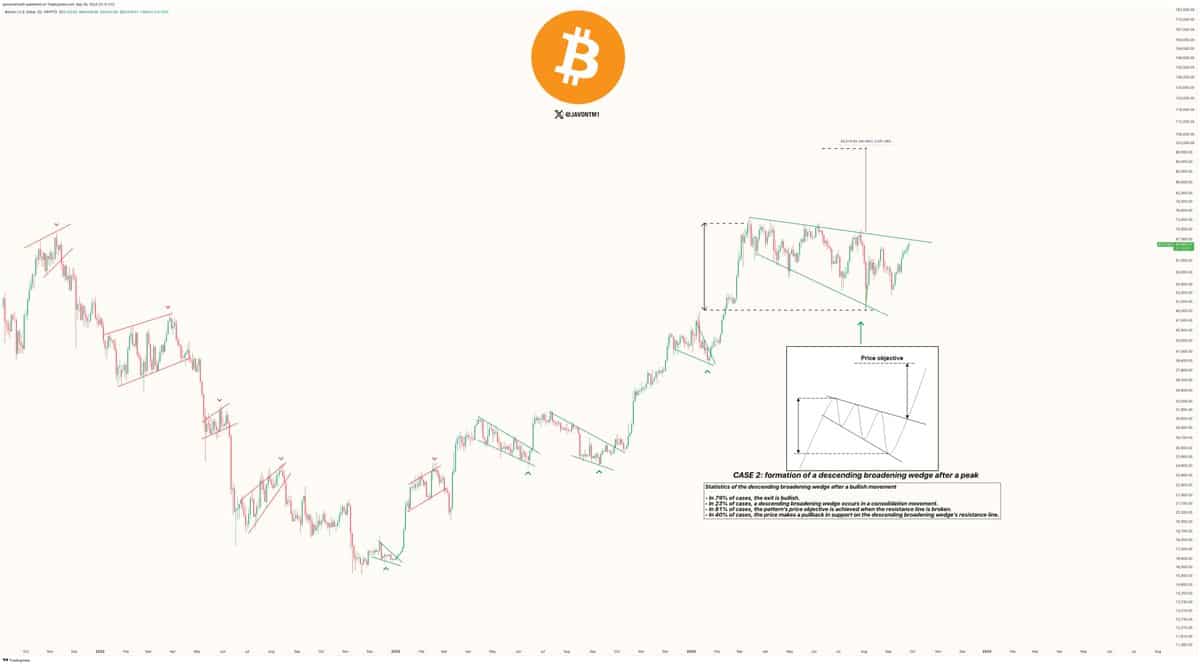
Javon Marks, a prominent crypto analyst, suggested that Bitcoin was nearing a critical resistance level defined by a “descending broadening wedge” pattern.

Source: Javon Marks/X
According to Marks, a bullish breakout past this resistance could propel Bitcoin to a target range of $99,000 to $100,000, an increase of over 51% from its current price.
His outlook emphasized that Bitcoin may be gearing up for a significant move in the coming weeks.
Similarly, another analyst, Captain Faibik, noted that Bitcoin bulls currently hold a strong position in the market.
Read Bitcoin’s [BTC] Price Prediction 2024–2025
With Bitcoin approaching a crucial resistance level of $68,000, Faibik speculated that a successful breakout from the broadening wedge could see the cryptocurrency reach $88,000 to $90,000 by the end of December.
However, he also cautions that failure to break through this resistance, or a potential fake-out, could see Bitcoin retest support zones around $57,000.


Source: Captain Faibik on X


Leave a Reply