The crypto market has recorded a strong bullish action over the past few days by experiencing a massive inflow of digital assets. Moreover, with the global market cap surpassing the $2.10 Trillion mark, the price of Bitcoin is back around the $60,000 level.
Following this, top tokens such as Ethereum and Ripple have breached their important resistance levels and are on the verge of experiencing a potential break-out rally.
Wondering how will 3 of the oldest cryptocurrencies perform amid increased uncertainty in the crypto market? Fear not and hop on as this article might be the one for you!
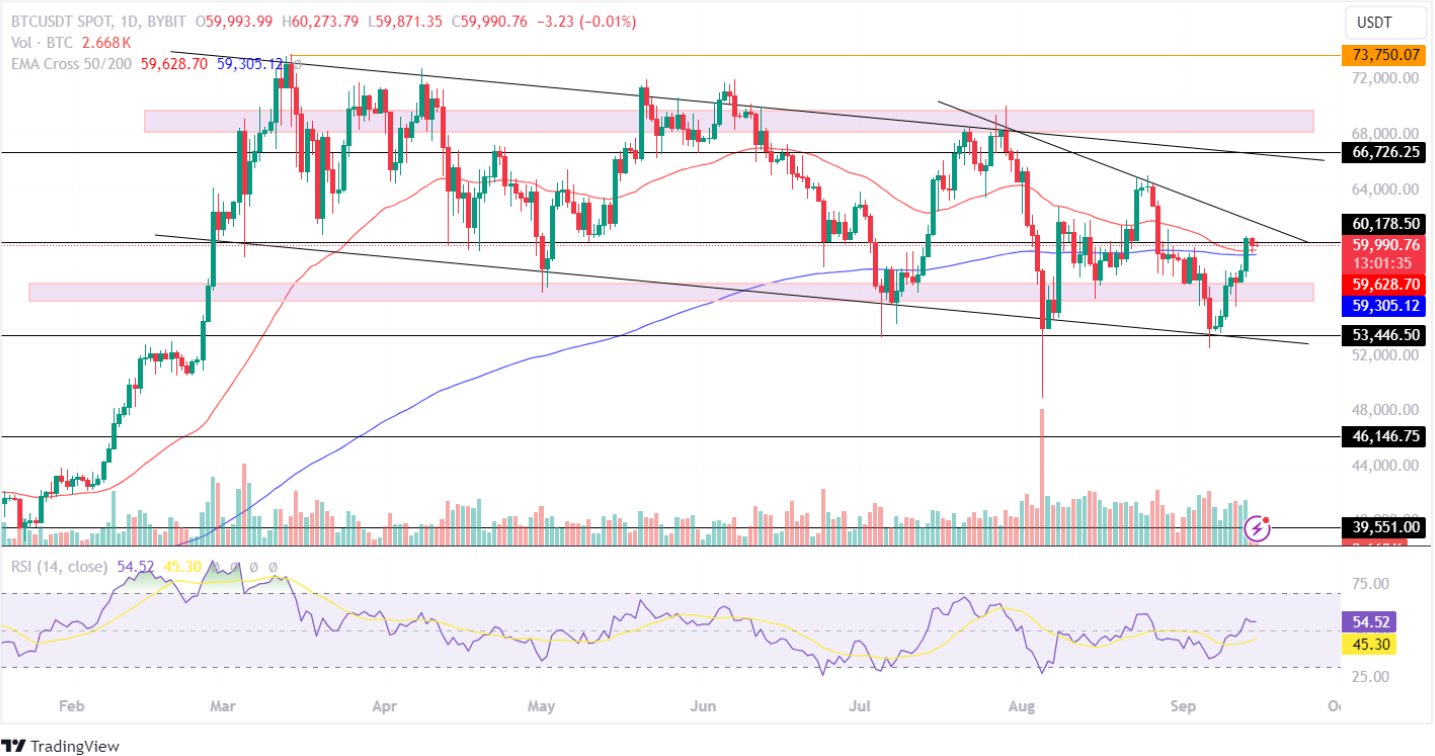
Bitcoin Price Retests Its Resistance Level of $60K!
With a jump of ~1% within the past day, the BTC price continues hovering around its resistance/support level of $60k. However, the star crypto has added 9.91% over the past week and 2.68% during the past month. This indicates a rising bullish sentiment for Bitcoin prices.

The Relative Strength Index (RSI) has recorded a stable price trend in the 1D time frame. However, the average trendline shows a bullish curve. This suggests a mixed price sentiment for the Bitcoin token.
If the market maintains the BTC price above its important level of $60k, the bulls will regain momentum and prepare to head toward its resistance level of $66k in the coming time. However, a bearish reversal could pull the price toward its low of $58,000.
Read our Bitcoin (BTC) Price Prediction to check if $100k is still possible in 2024!
Ethereum Price Experiences A Decline In Bullish Action
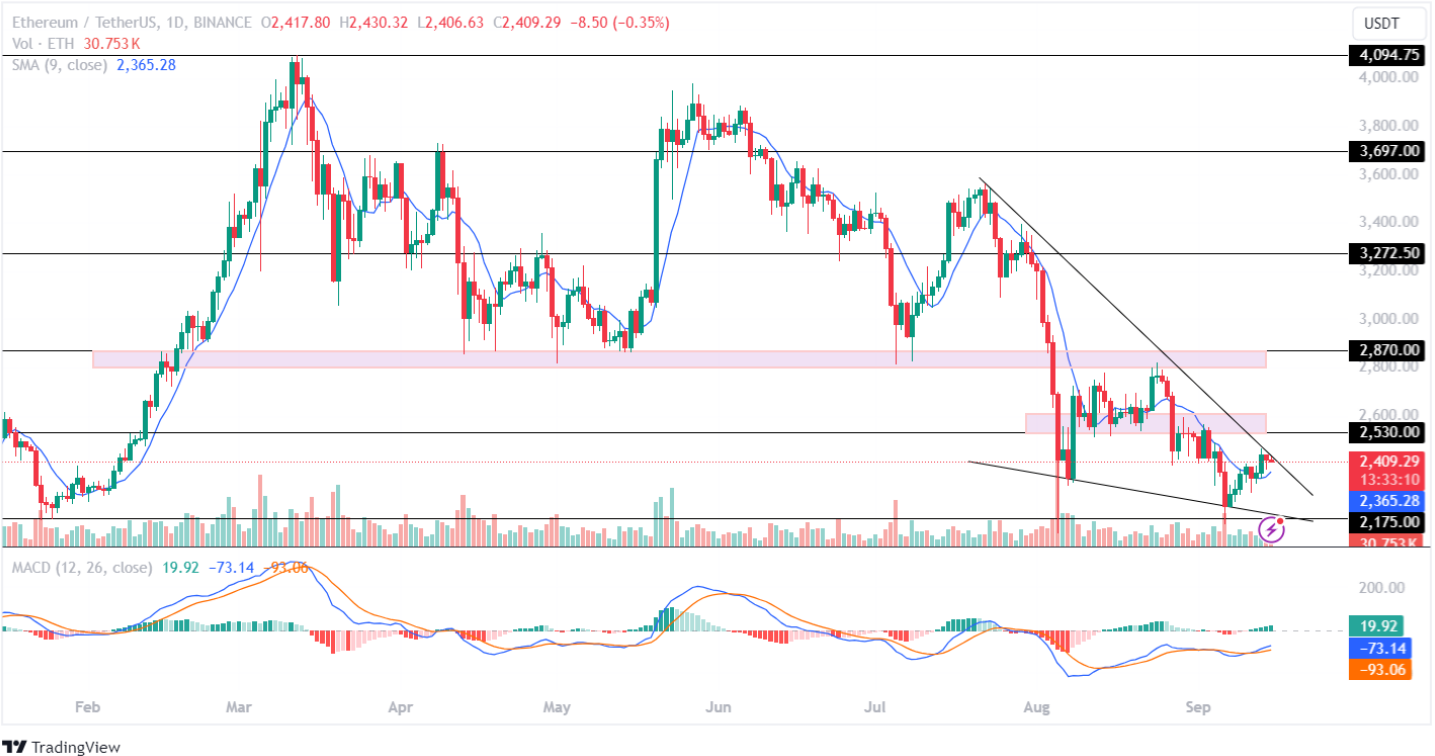
Following in the footsteps of the market leader, the Ethereum price has held its value above the $2.4k mark despite recording a drop of 0.59% over the past day. However, the largest altcoin is on the verge of testing its resistance trendline in the 1D time frame.

The Moving Average Convergence Divergence (MACD) has displayed a constant rise in the green histogram with a bullish rise in its averages. This indicates a positive outlook for the Ethereum price during the upcoming week.
A break out from its resistance trendline of the triangle pattern could result in the ETH coin price preparing to test its resistance level of $2.5k. On the flip side, a rejection could result in its retesting its crucial support level of $2,175 this month.
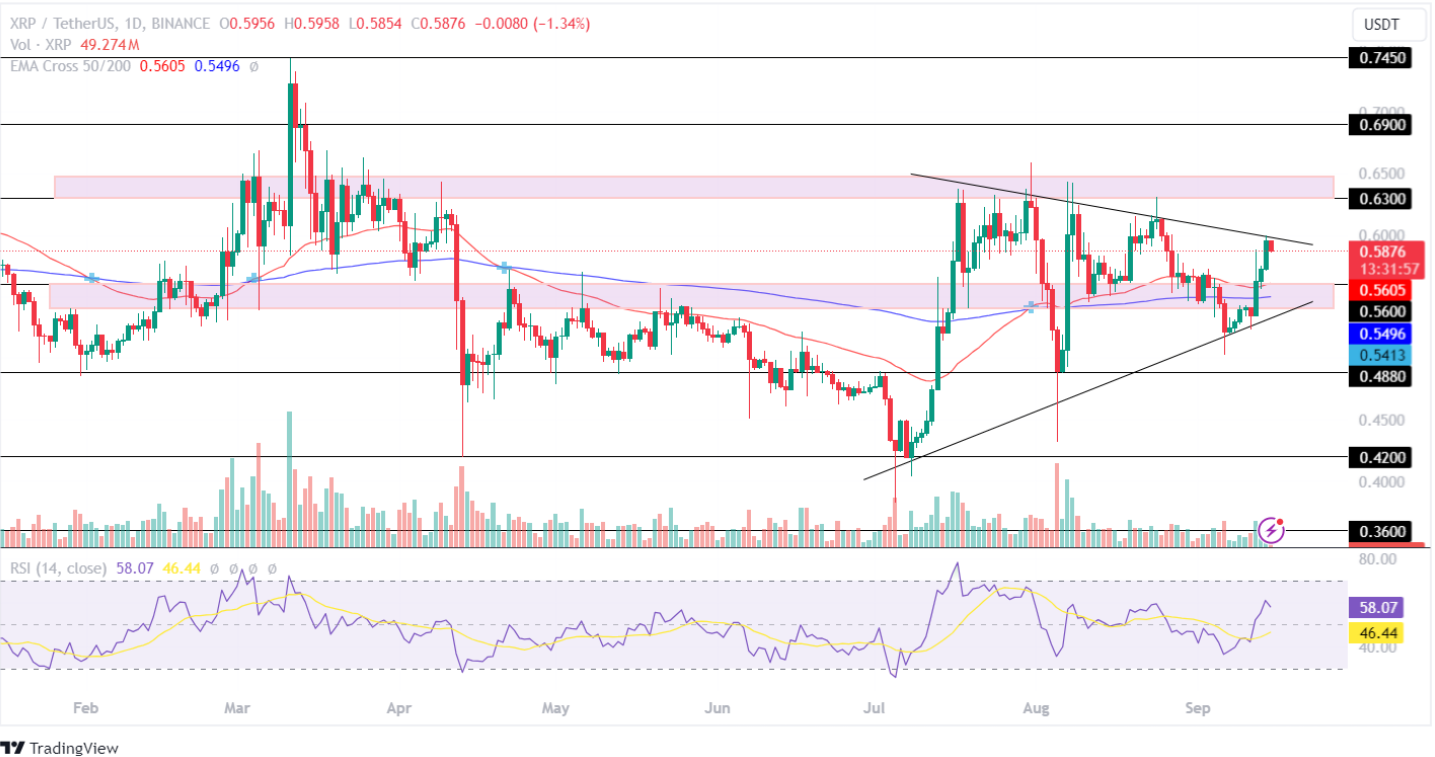
XRP Price Fails To Break Out Of Its Symmetric Triangle Pattern!
With a jump of ~11% over the past week, the Ripple price has breached its important resistance zone of $0.56. However, it has failed to break out of its resistance trendline of the triangle pattern. This indicates a mixed price sentiment for the XRP crypto in the market.

The EMA 50/200-day has recorded a constant flatline in the 1D time frame. This highlights a weak buying-and-selling pressure for the altcoin in the crypto market. Further, the RSI indicator has experienced a bearish curve, suggesting increased volatility for the XRP crypto token.
If the bulls regain momentum, the Ripple price will break its resistance trendline and head toward its upper level of $0.630 this month. On the contrary, if the bears overpowered the bulls, the altcoin could plunge toward its low of $0.560.
Concerned about your XRP holdings? Read our XRP Price Prediction for future insights.


Leave a Reply