
- XRP could break 7-year resistance with a potential 500% surge, analysts suggest a bullish breakout.
- Growing interest in XRP derivatives and bullish chart patterns hint at major price movement potential.
XRP’s current price movement has caught the attention of market analysts, as the crypto shows signs of a potential bullish breakout.
Crypto analyst Javon Marks has noted that the setup on XRP’s chart reveals multiple hidden bullish divergences, hinting at a possible 500% price increase.
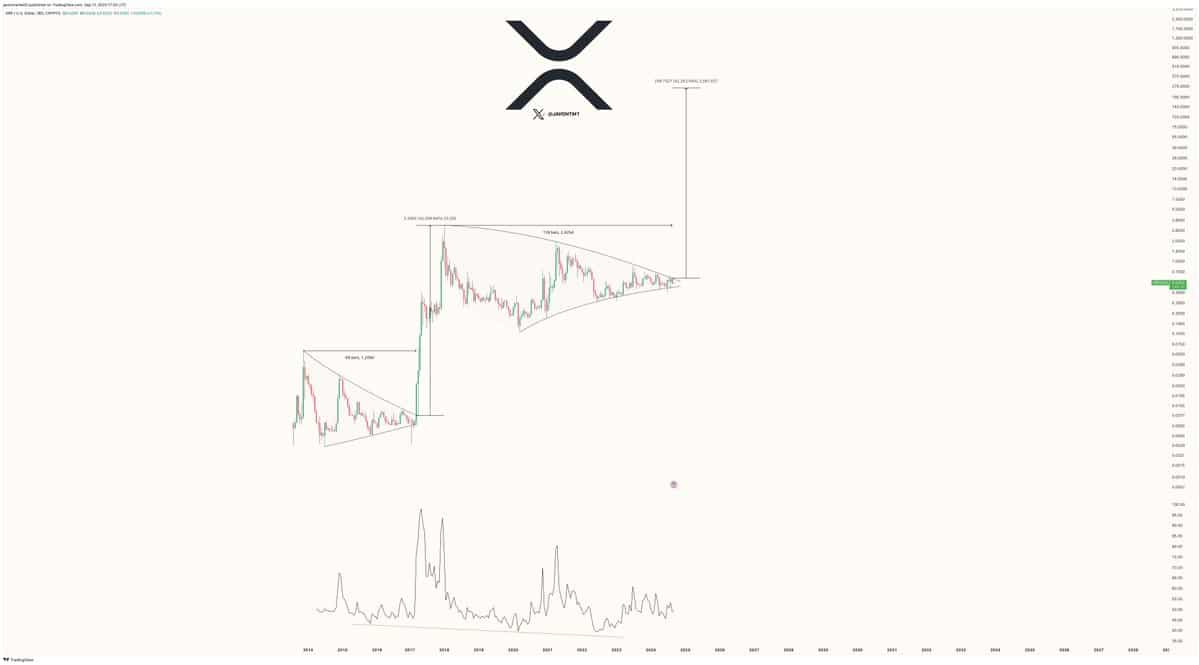
With XRP currently consolidating within a large symmetrical triangle, analysts are speculating whether the token could break its 7-year resistance and reach as high as $3.313 in the near term.
Historical bullish trends indicate strong potential
XRP’s chart history reveals two major bullish breakouts from symmetrical triangles. The first occurred in 2017, leading to a rally of 1,220%, and the second in 2020, which saw the price increase by 2,436%.
Meanwhile, these previous breakouts suggest that XRP has a history of substantial price movements when similar chart patterns emerge. XRP was trading within another symmetrical triangle at press time, and many believe that it could replicate past performance.
Source: X
Crypto experts point out that hidden bullish divergences often lead to strong upward movements, and the multiple confirmations on the XRP chart indicate the potential for another large rally.
This could result in XRP breaking its long-standing resistance level, which has been in place for nearly seven years.
Technical indicators show mixed signals
At the time of writing, XRP was priced at $0.5371, with a slight 0.70% increase in the last 24 hours. However, over the past week, the price has declined by 2.85%.
Bollinger Bands, a popular volatility indicator, were tightening around the current price, suggesting lower volatility in the short term.
Additionally, the price was hovering near the middle band, which represents the 20-day moving average, indicating a neutral to slightly bearish trend.
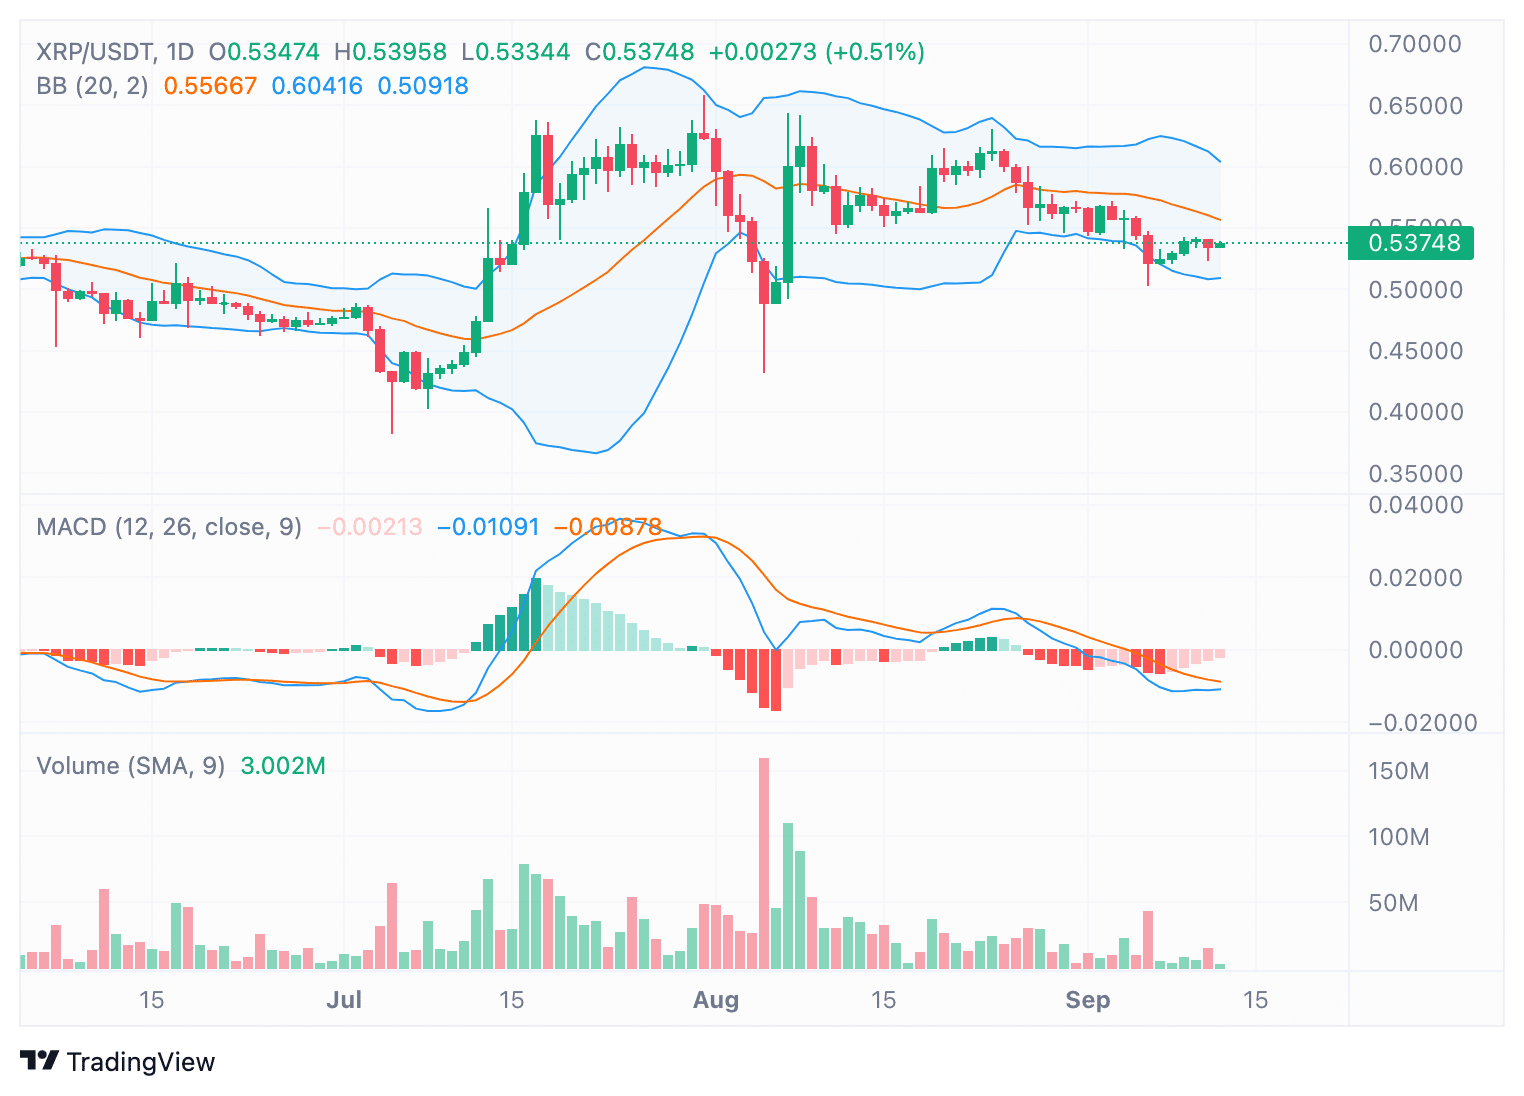
The MACD (Moving Average Convergence Divergence) indicator, another widely-used tool for predicting price direction, shows a bearish signal with the MACD line below the signal line.
However, the histogram is beginning to show signs of reduced negative momentum, which could hint at a potential slowdown in the bearish trend.
Increased interest in XRP derivatives
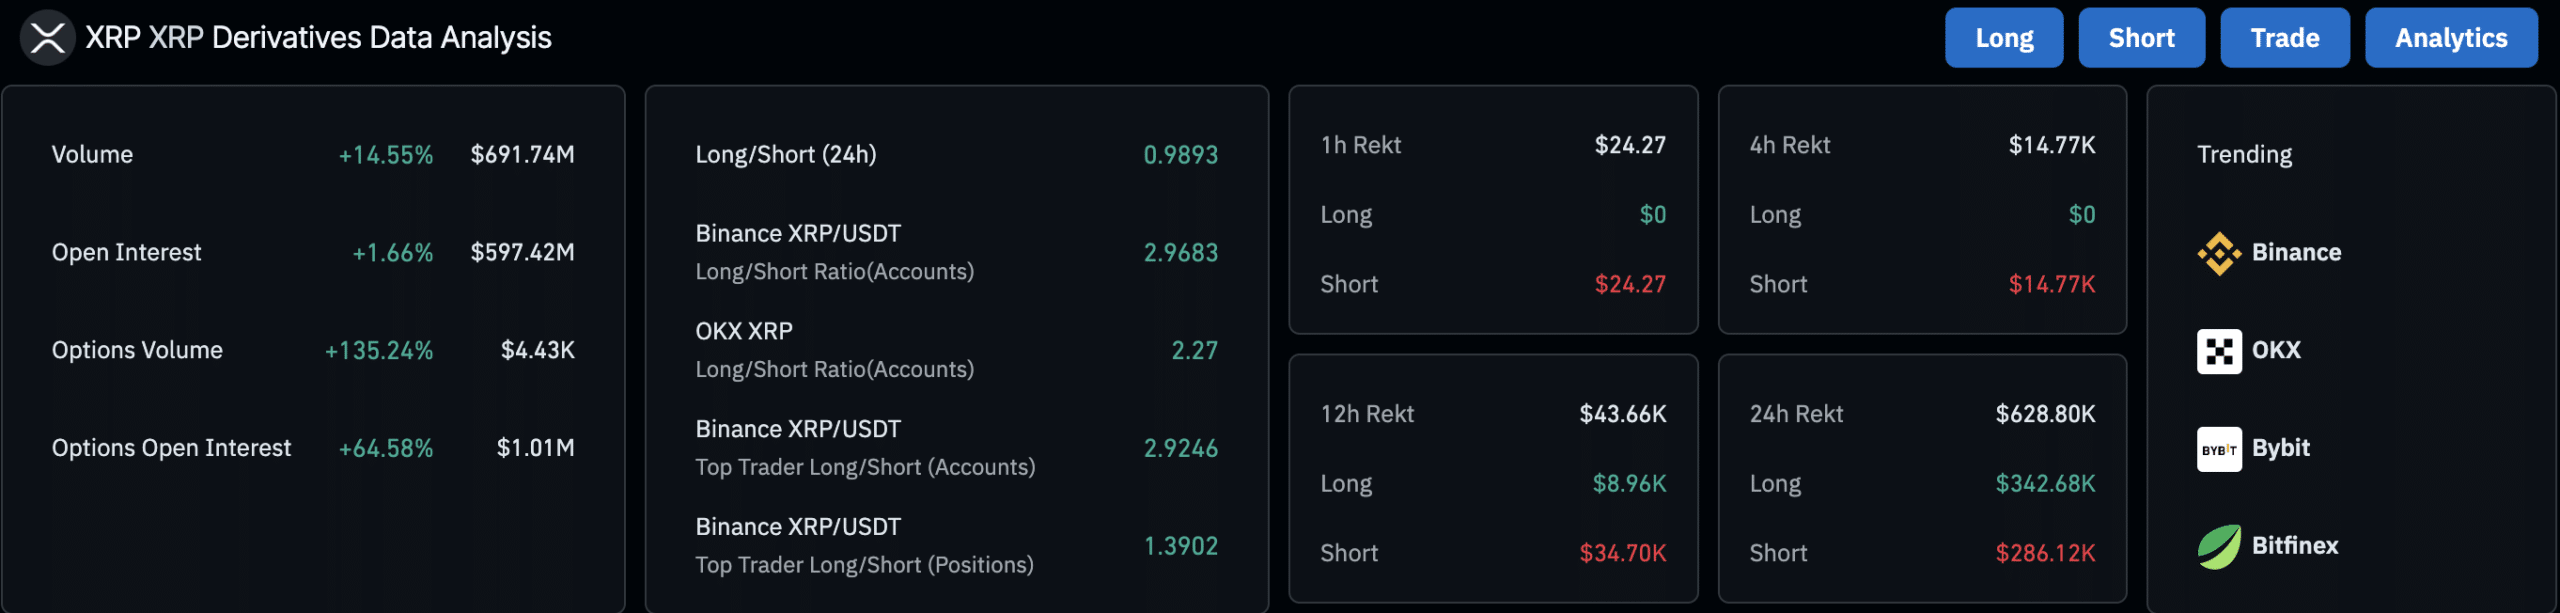
Recent Coinglass data shows growing interest in XRP derivatives. Trading volume has risen by 14.55% to $691.74 million, and open interest has increased by 1.66%, reaching $597.42 million.
Options trading, in particular, has seen a sharp rise, with volume surging by 135.24%, and options open interest growing by 64.58%. This uptick in derivatives activity suggests that traders are positioning themselves for potential price movements in the near future.
Source: Coinglass
The long/short ratio for the last 24 hours is close to neutral, standing at 0.9893. However, on major exchanges like Binance and OKX, the data reveals that traders are leaning heavily towards long positions.
Binance’s long/short ratio is 2.9683, while OKX is at 2.27, showing a strong bias towards bullish expectations.
Additionally, XRP’s liquidation data over the past 24 hours shows that short positions have been hit the hardest, with a total of $14.83K in liquidations, compared to just $2.42K for long positions.
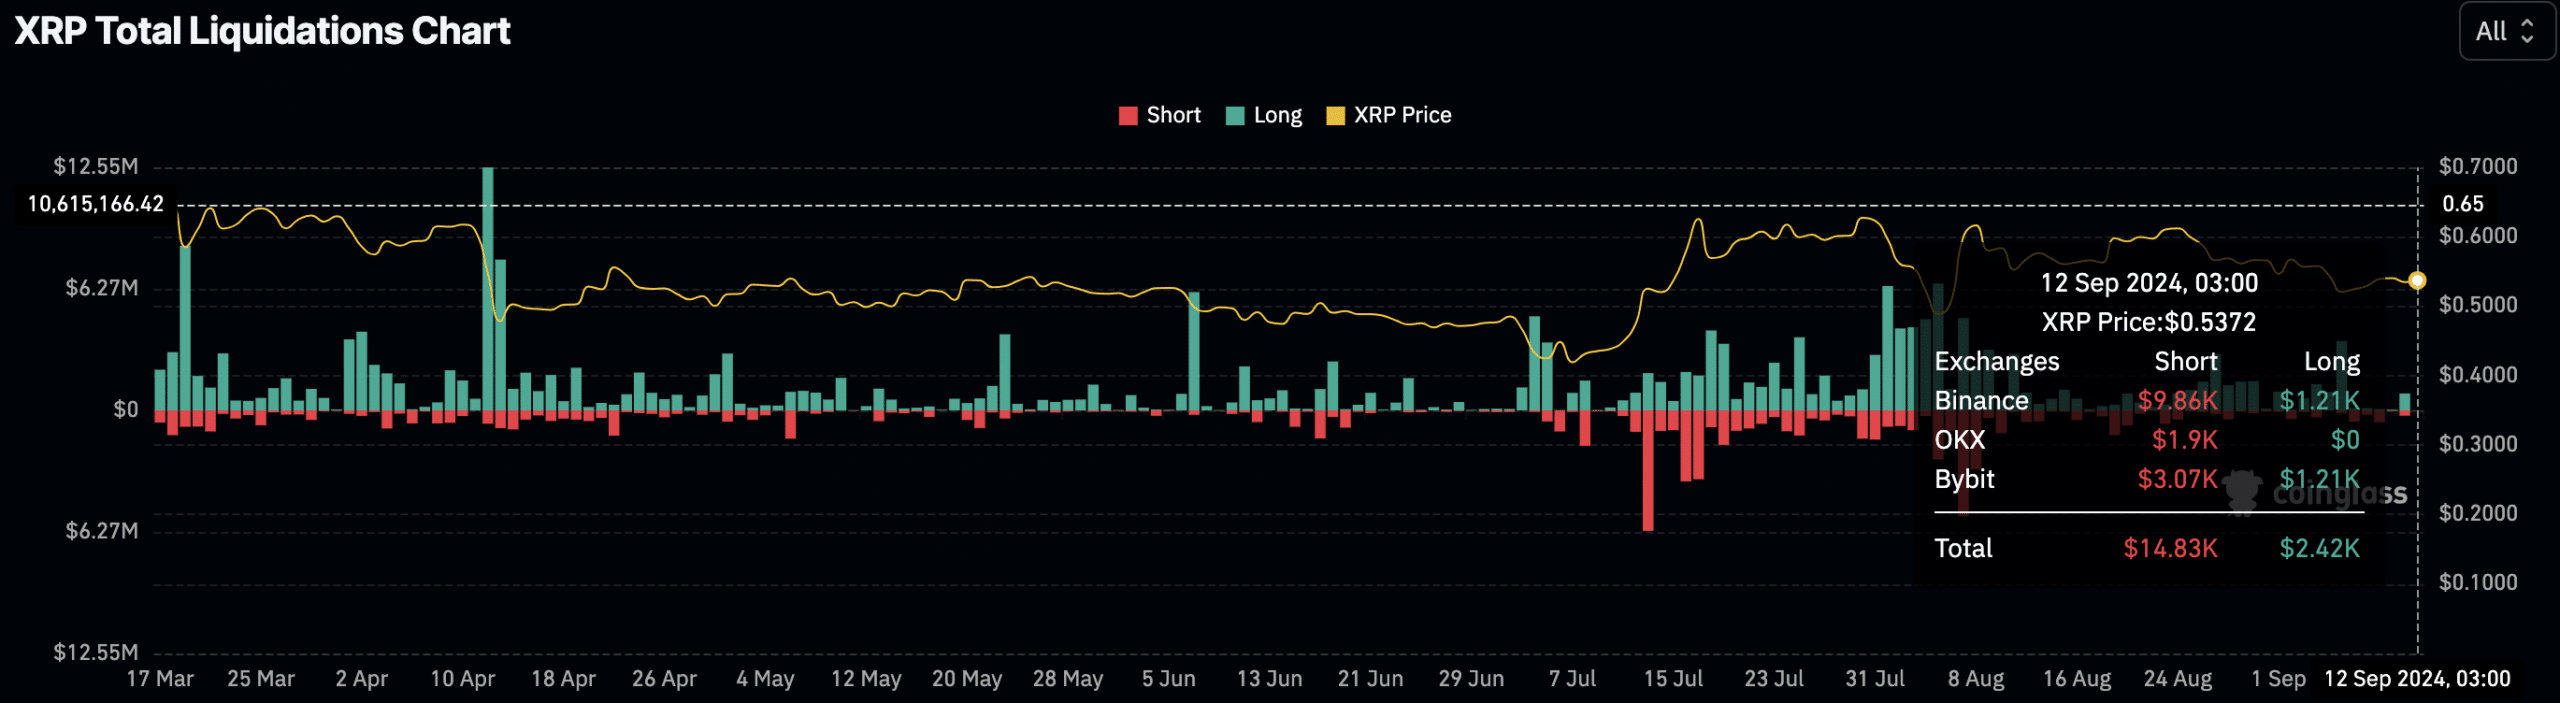
Source: Coinglass
Read Ripple’s [XRP] Price Prediction 2024-25
This liquidation data aligns with the overall market sentiment, where short traders have faced larger losses, possibly indicating a shift in market direction.
With XRP’s history of explosive price movements and current chart patterns indicating hidden bullish signals, many traders are keeping a close eye on the token.