

- BTC has declined by 10.85% on monthly charts.
- An analysts cites 2019 consolidation cycle as a sign for upcoming uptrend.
Over the past month, Bitcoin [BTC] has defied all market predictions. In fact, it has continued to decline despite, market expectations for a rebound.
As of this writing, BTC was trading at $54,439 after dropping by 6.5% over the last seven days. Equally, the king crypto has declined by 10.85% over the last 30 days. This decline has seen Bitcoin’s trading volume plummet by 65.23% to $16.1 billion on daily charts.
Despite this decline, the prevailing market sentiment remains optimistic. Inasmuch as analysts continually eye a rebound. For instance, popular crypto analyst Bittel Julien suggested an upcoming rally citing the 2019 cycle.
Prevailing market sentiment
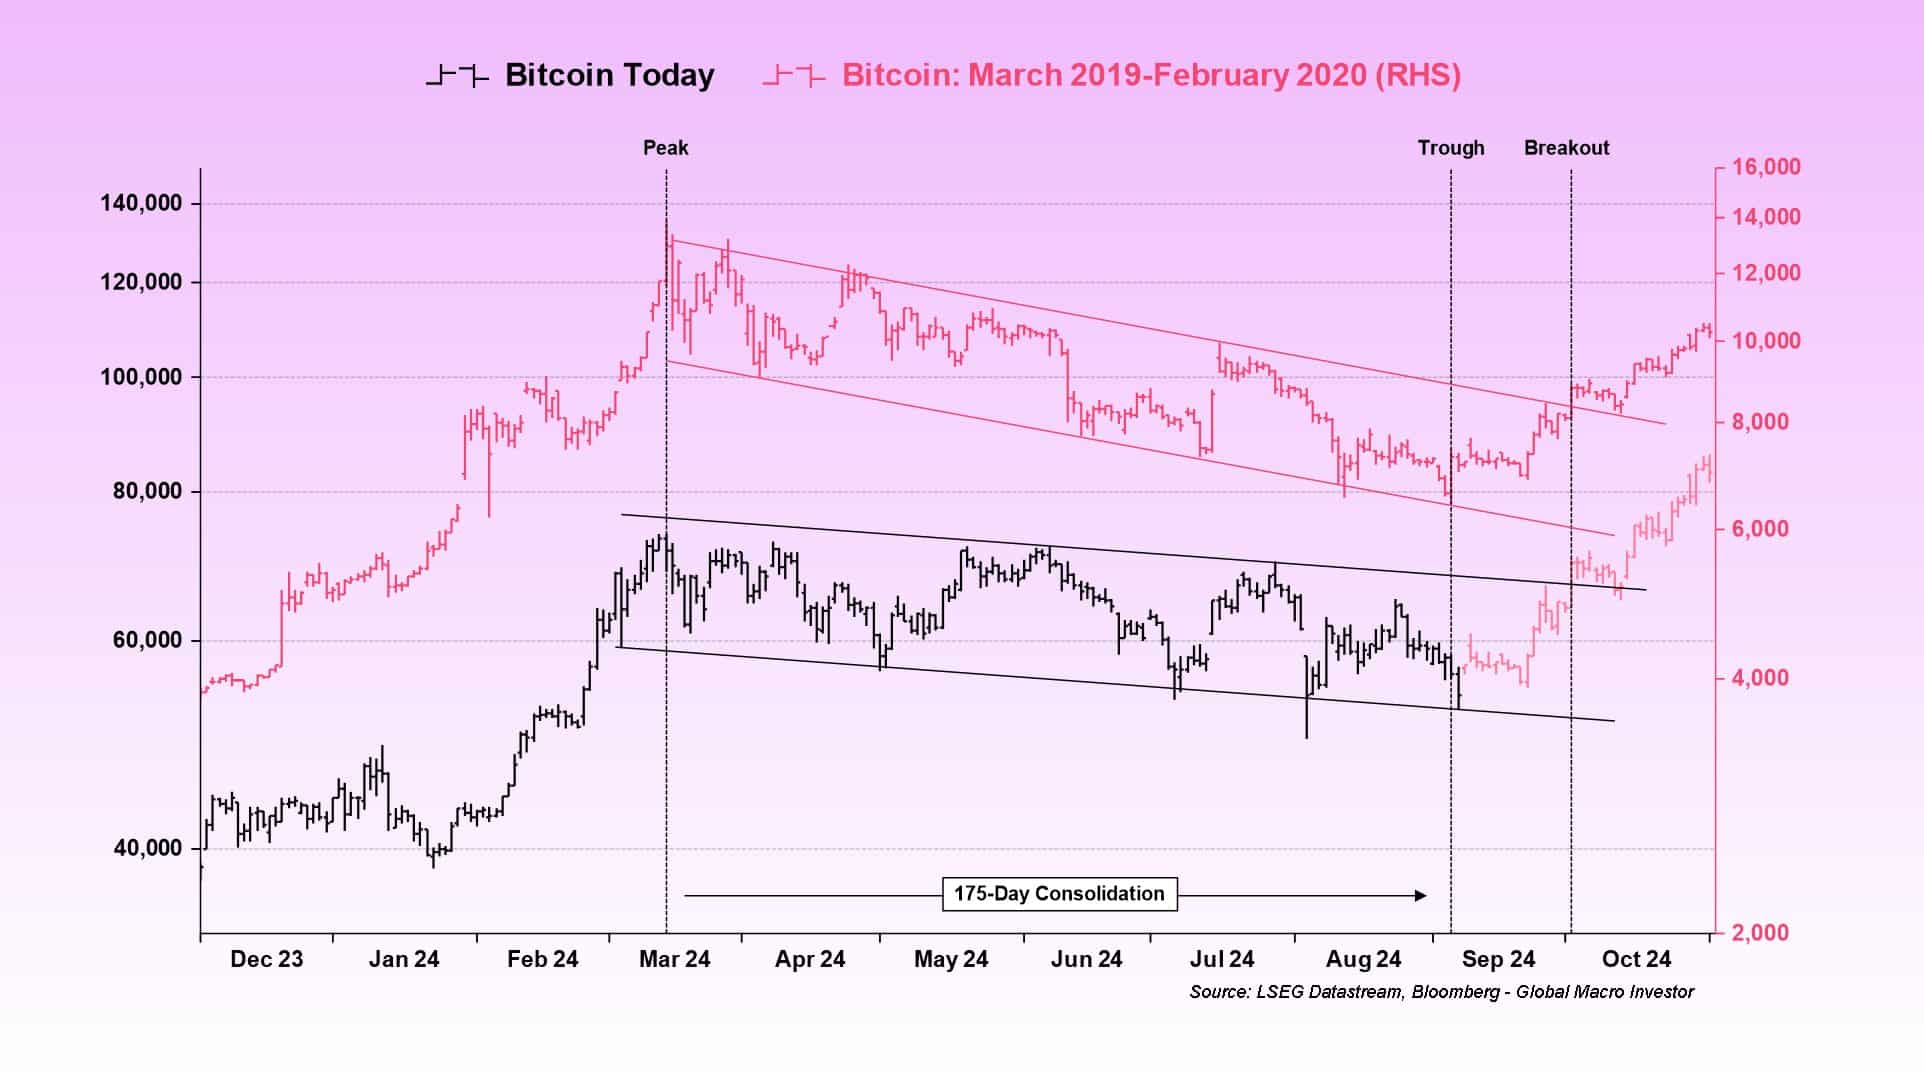
In his analysis, Julien highlighted the current sustained consolidation phase. According to the analyst, the current consolidation phase has lasted 175 days.
Source: X
Just like the 2019 cycle, Bitcoin is stuck in a similar consolidation phase. Therefore, if BTC follows the same script, it will result in upward movement.
Based on this analysis, BTC shifted from $7,200 to $10,000 in 2020 after the long consolidation. Although it declined after, this was attributed to the pandemic. Thus, the analysts see an upcoming rebound after the long consolidation.
Therefore, If history was any indicator, we might be on the brink of either a substantial breakout or a continuation of the consolidation pattern.
What BTC charts suggest
While Julien highlighted one key indicator suggesting a potential reversal, the question is, do the other metrics agree?
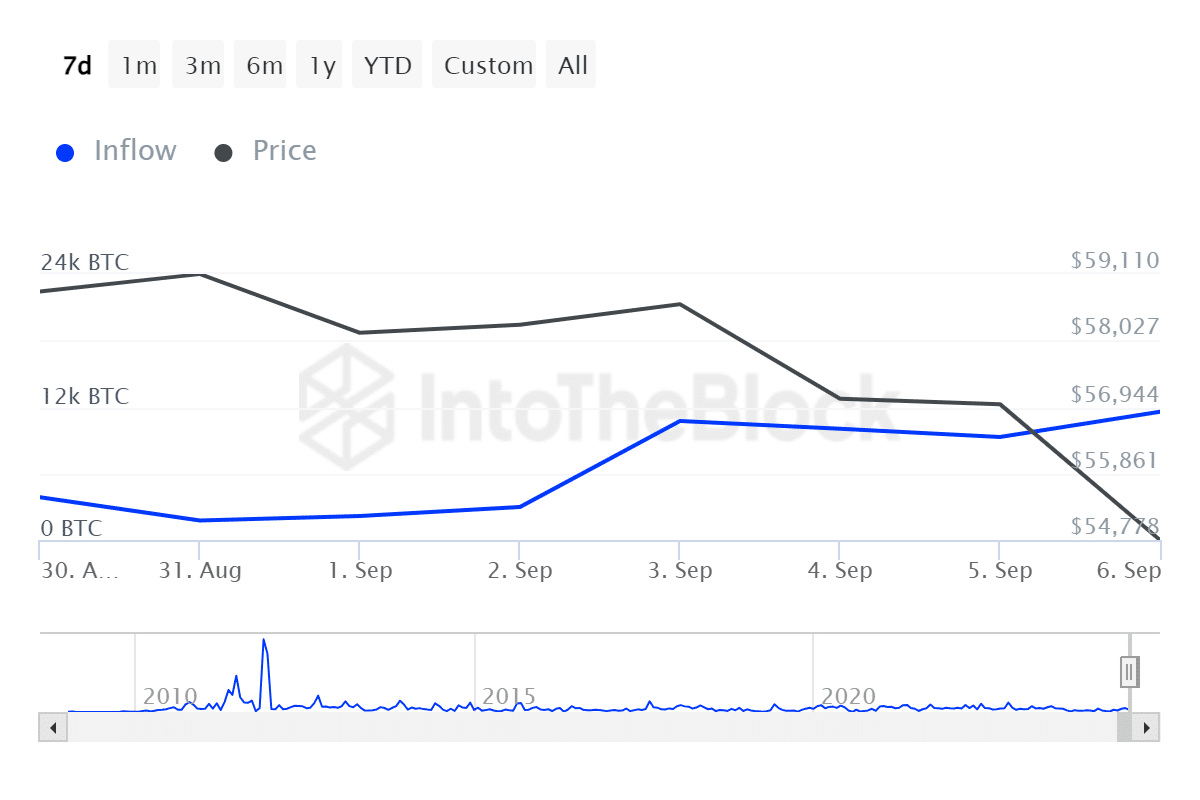
Source: IntoTheBlock
Firstly, over the past week, large holders inflow has experienced sustained growth from a low of 1.76k to 11.57k at press time. Since investors are buying during the market downturn, it suggests they are dying the dip.
The market behavior indicates accumulation signaling the investor’s confidence in potential future price gains. This is a bullish signal and increased accumulation results in buying pressure which pushes prices up.
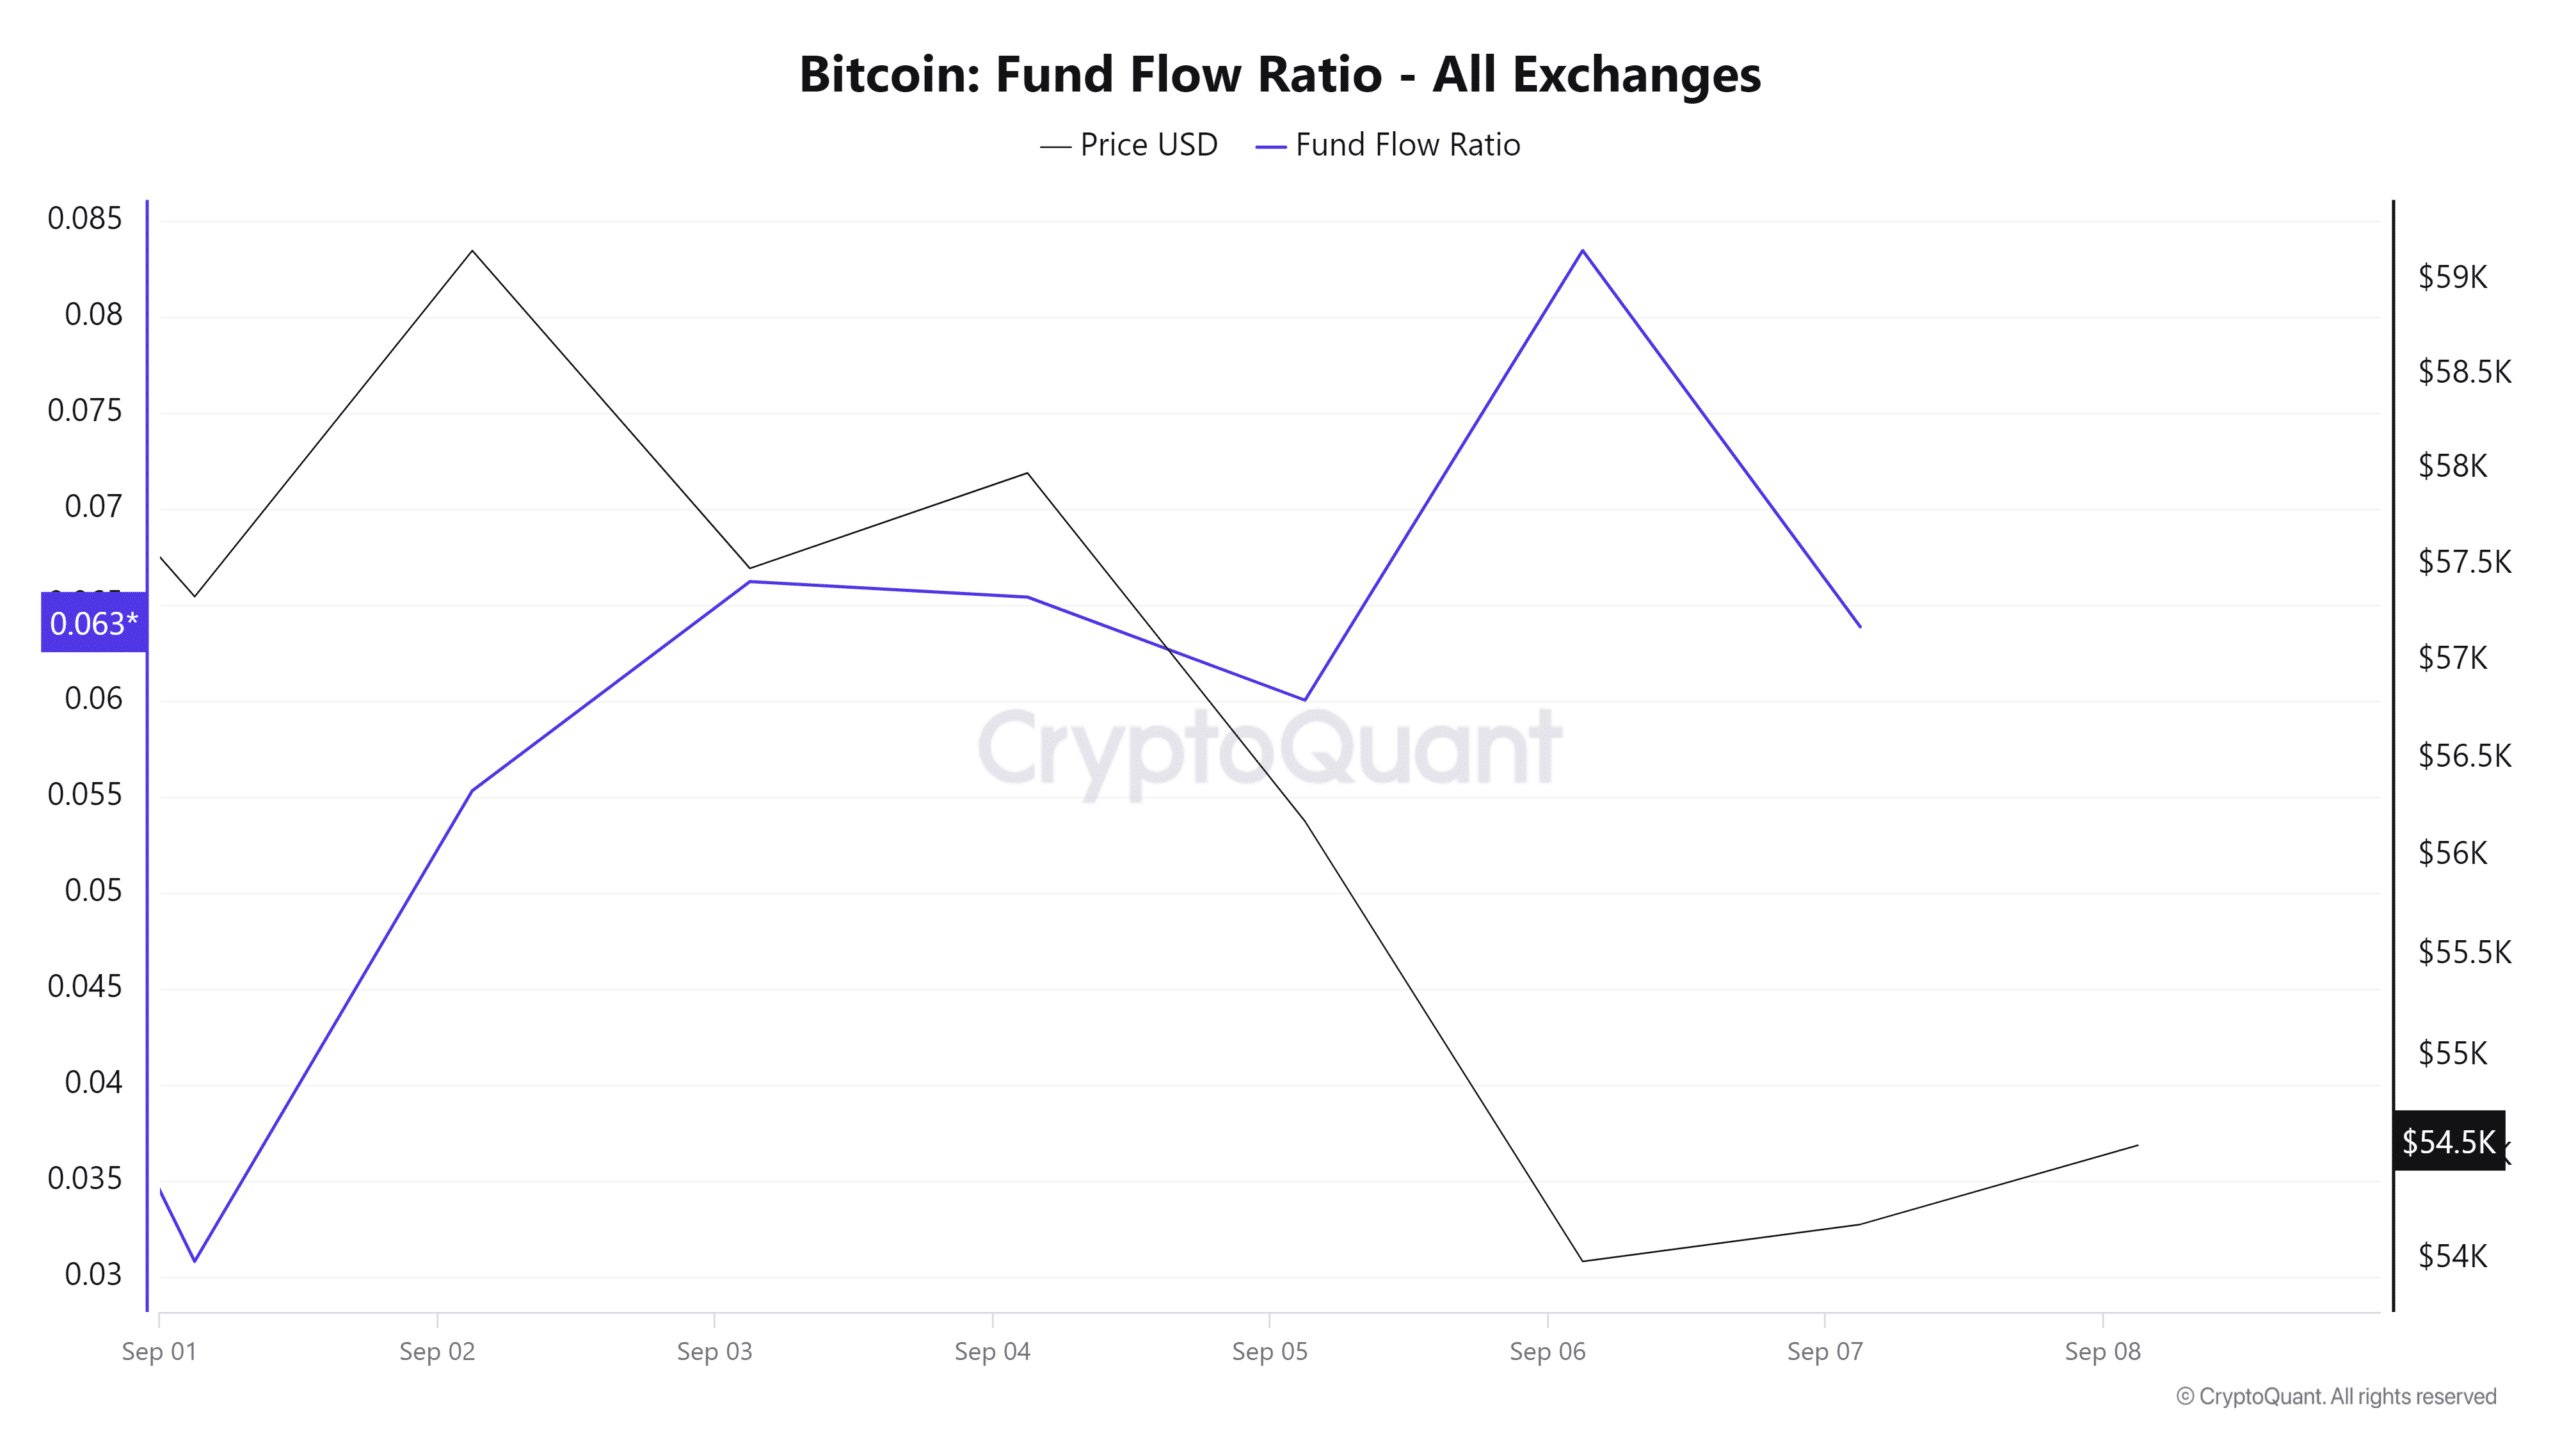
Source: CryptoQuant
Additionally, the fund flow ratio has increased over the past week. An increase in fund flow indicates capital inflow is greater than outflow. Such a market habit suggests increased buying activity which leads to upward price movement.
This usually reflects growing optimism among investors as they expect further gains.
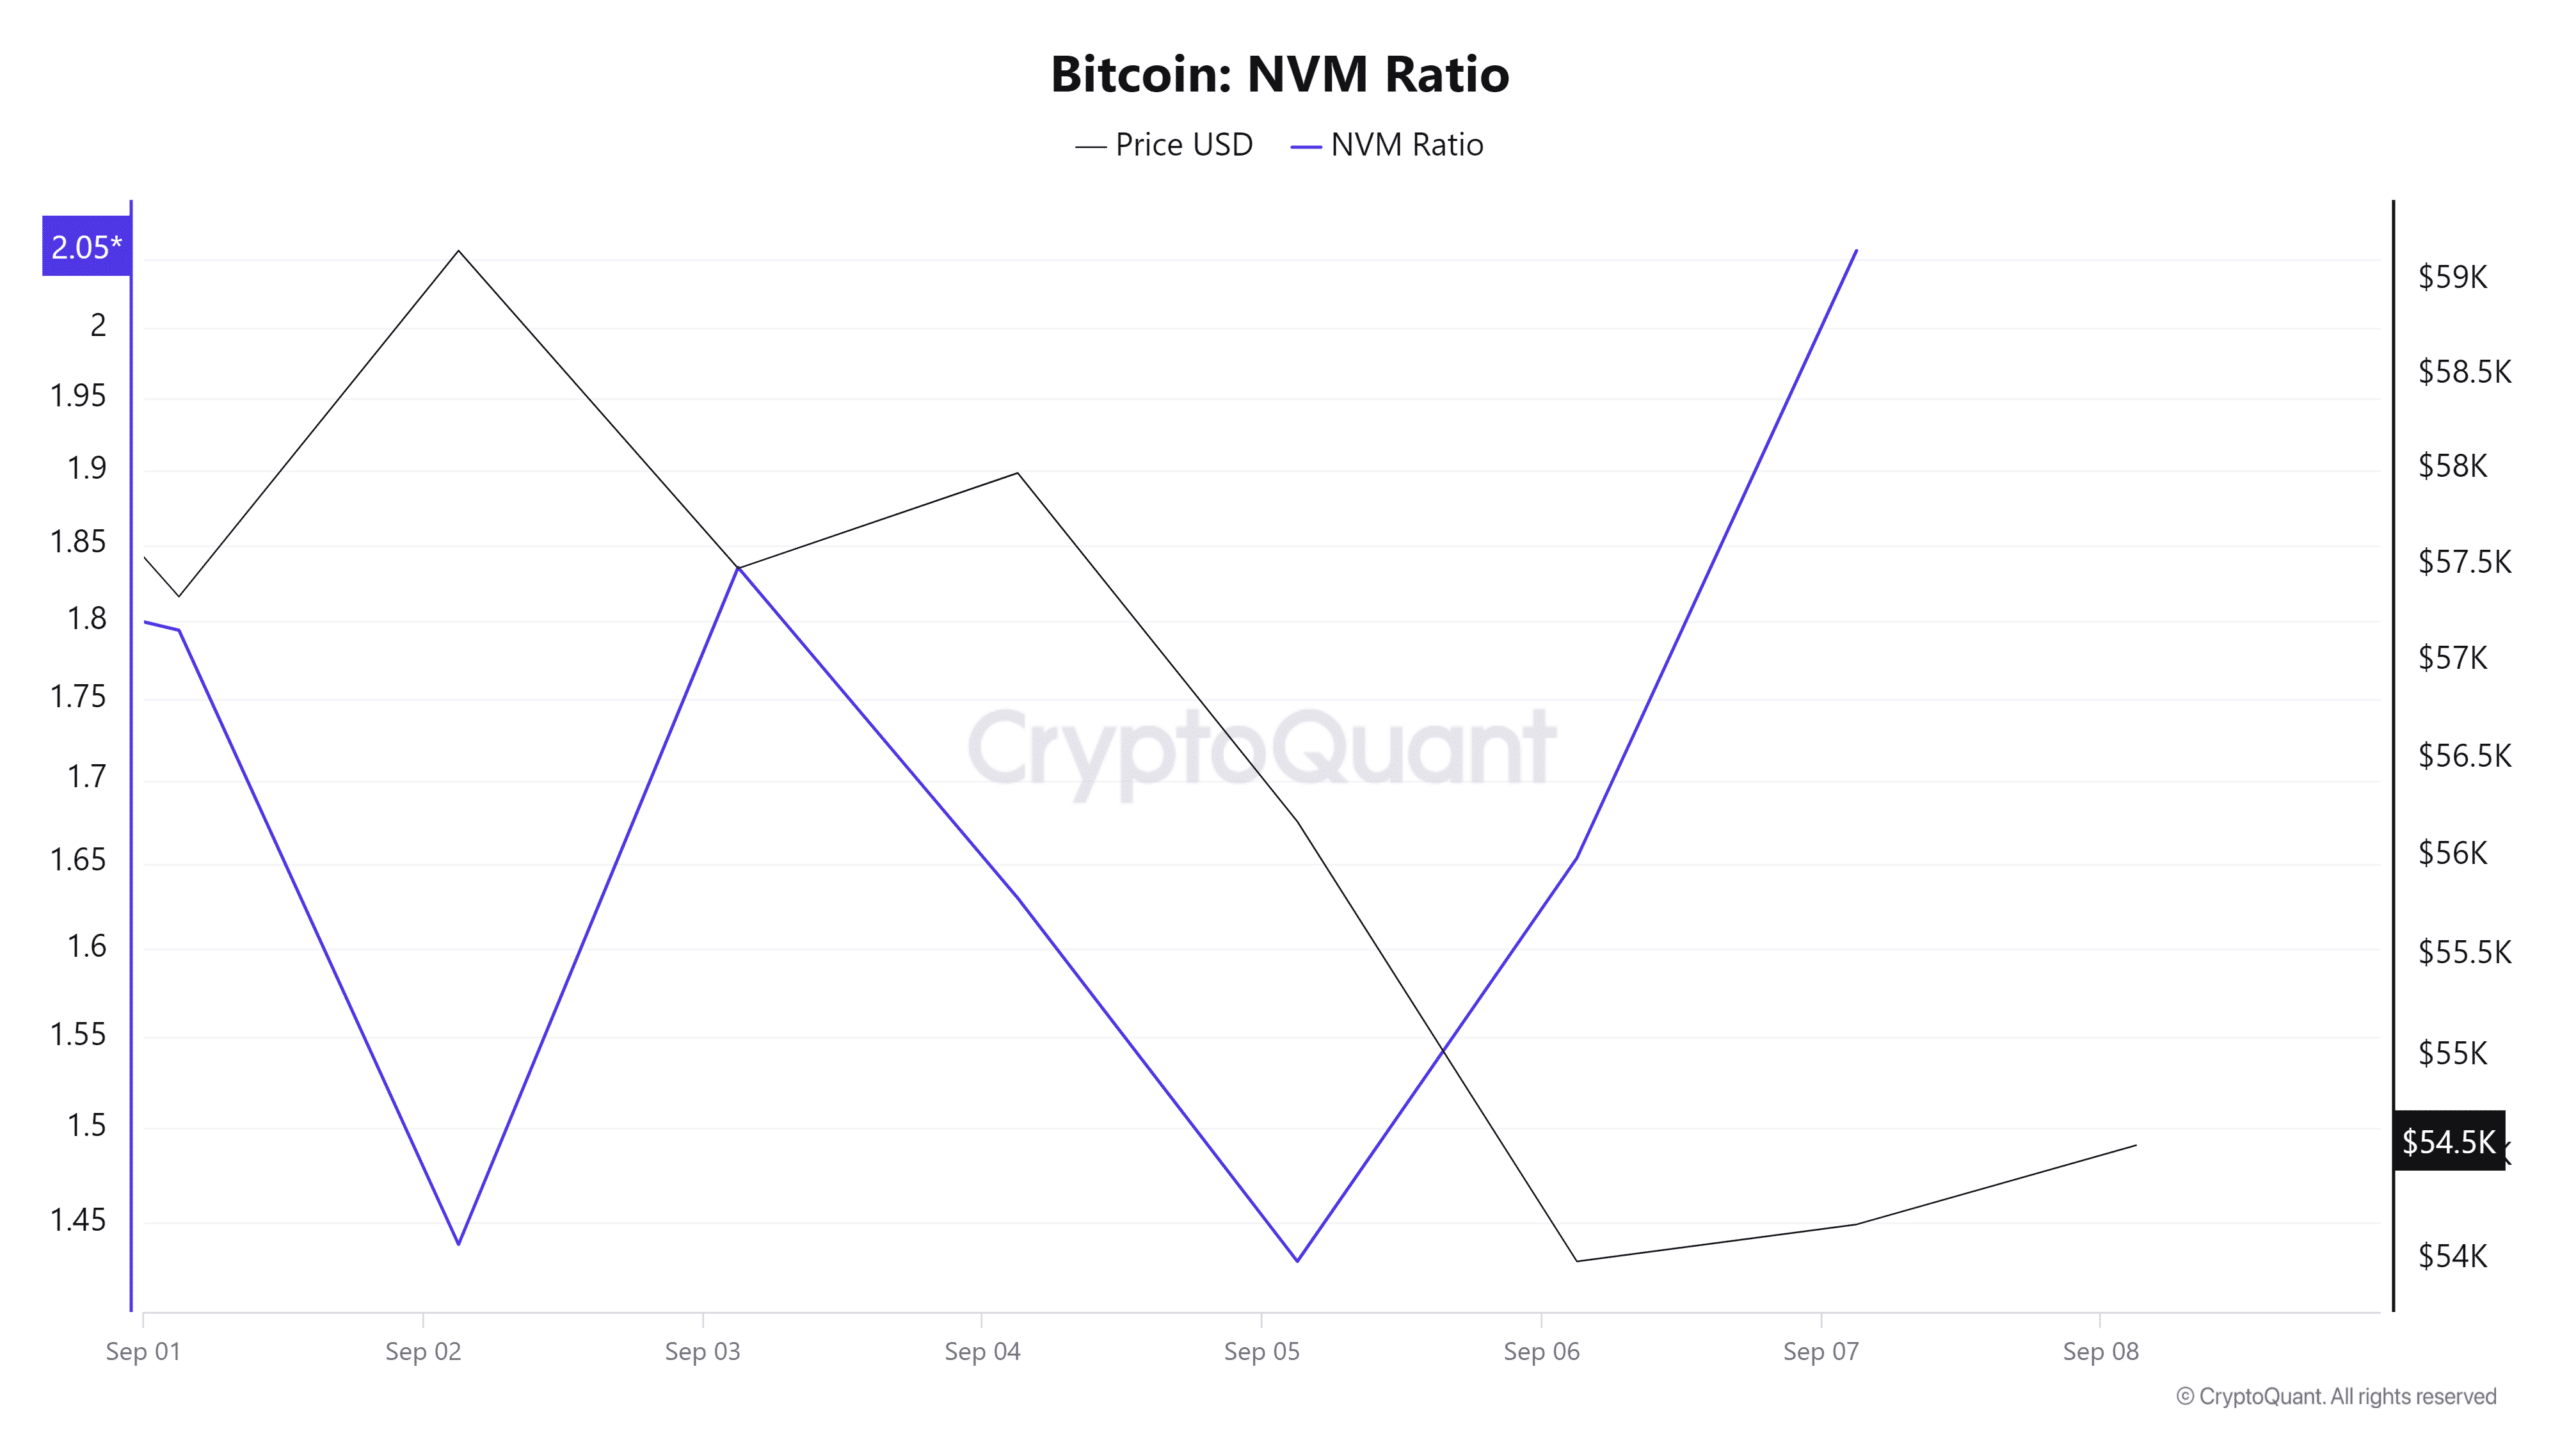
Source: CryptoQuant
Finally, the NVM ratio has increased from 1.4 to 2.05 over the past 7 days. This shows long-term holders are still holding despite the price decline.
Read Bitcoin’s [BTC] Price Prediction 2024-25
Such market behavior suggests confidence among long-term investors.
Coupled with current market favorability, BTC is well positioned for a reversal above the $56K resistance level.