

- ETH and BTC seemed to be at oversold levels on the charts
- Bitcoin has seen more gains over the last two years, compared to ETH
Bitcoin (BTC) and Ethereum (ETH) remain the largest cryptocurrency assets by market capitalization. However, ETH has underperformed BTC over the last two years, despite both assets seeing significant price fluctuations.
While both BTC and ETH saw the approval of Spot Exchange Traded Funds (ETFs) recently, this development has not been enough to reverse the altcoin’s relative underperformance.
Ethereum slides against Bitcoin
According to data from CryptoQuant, Ethereum has underperformed Bitcoin by 44% over the past two years. The analysis indicated that ETH’s decline relative to BTC began after The Merge, which transitioned Ethereum from a Proof of Work (PoW) to a Proof of Stake (PoS) consensus mechanism.
Since then, Ethereum has struggled to keep pace with Bitcoin.
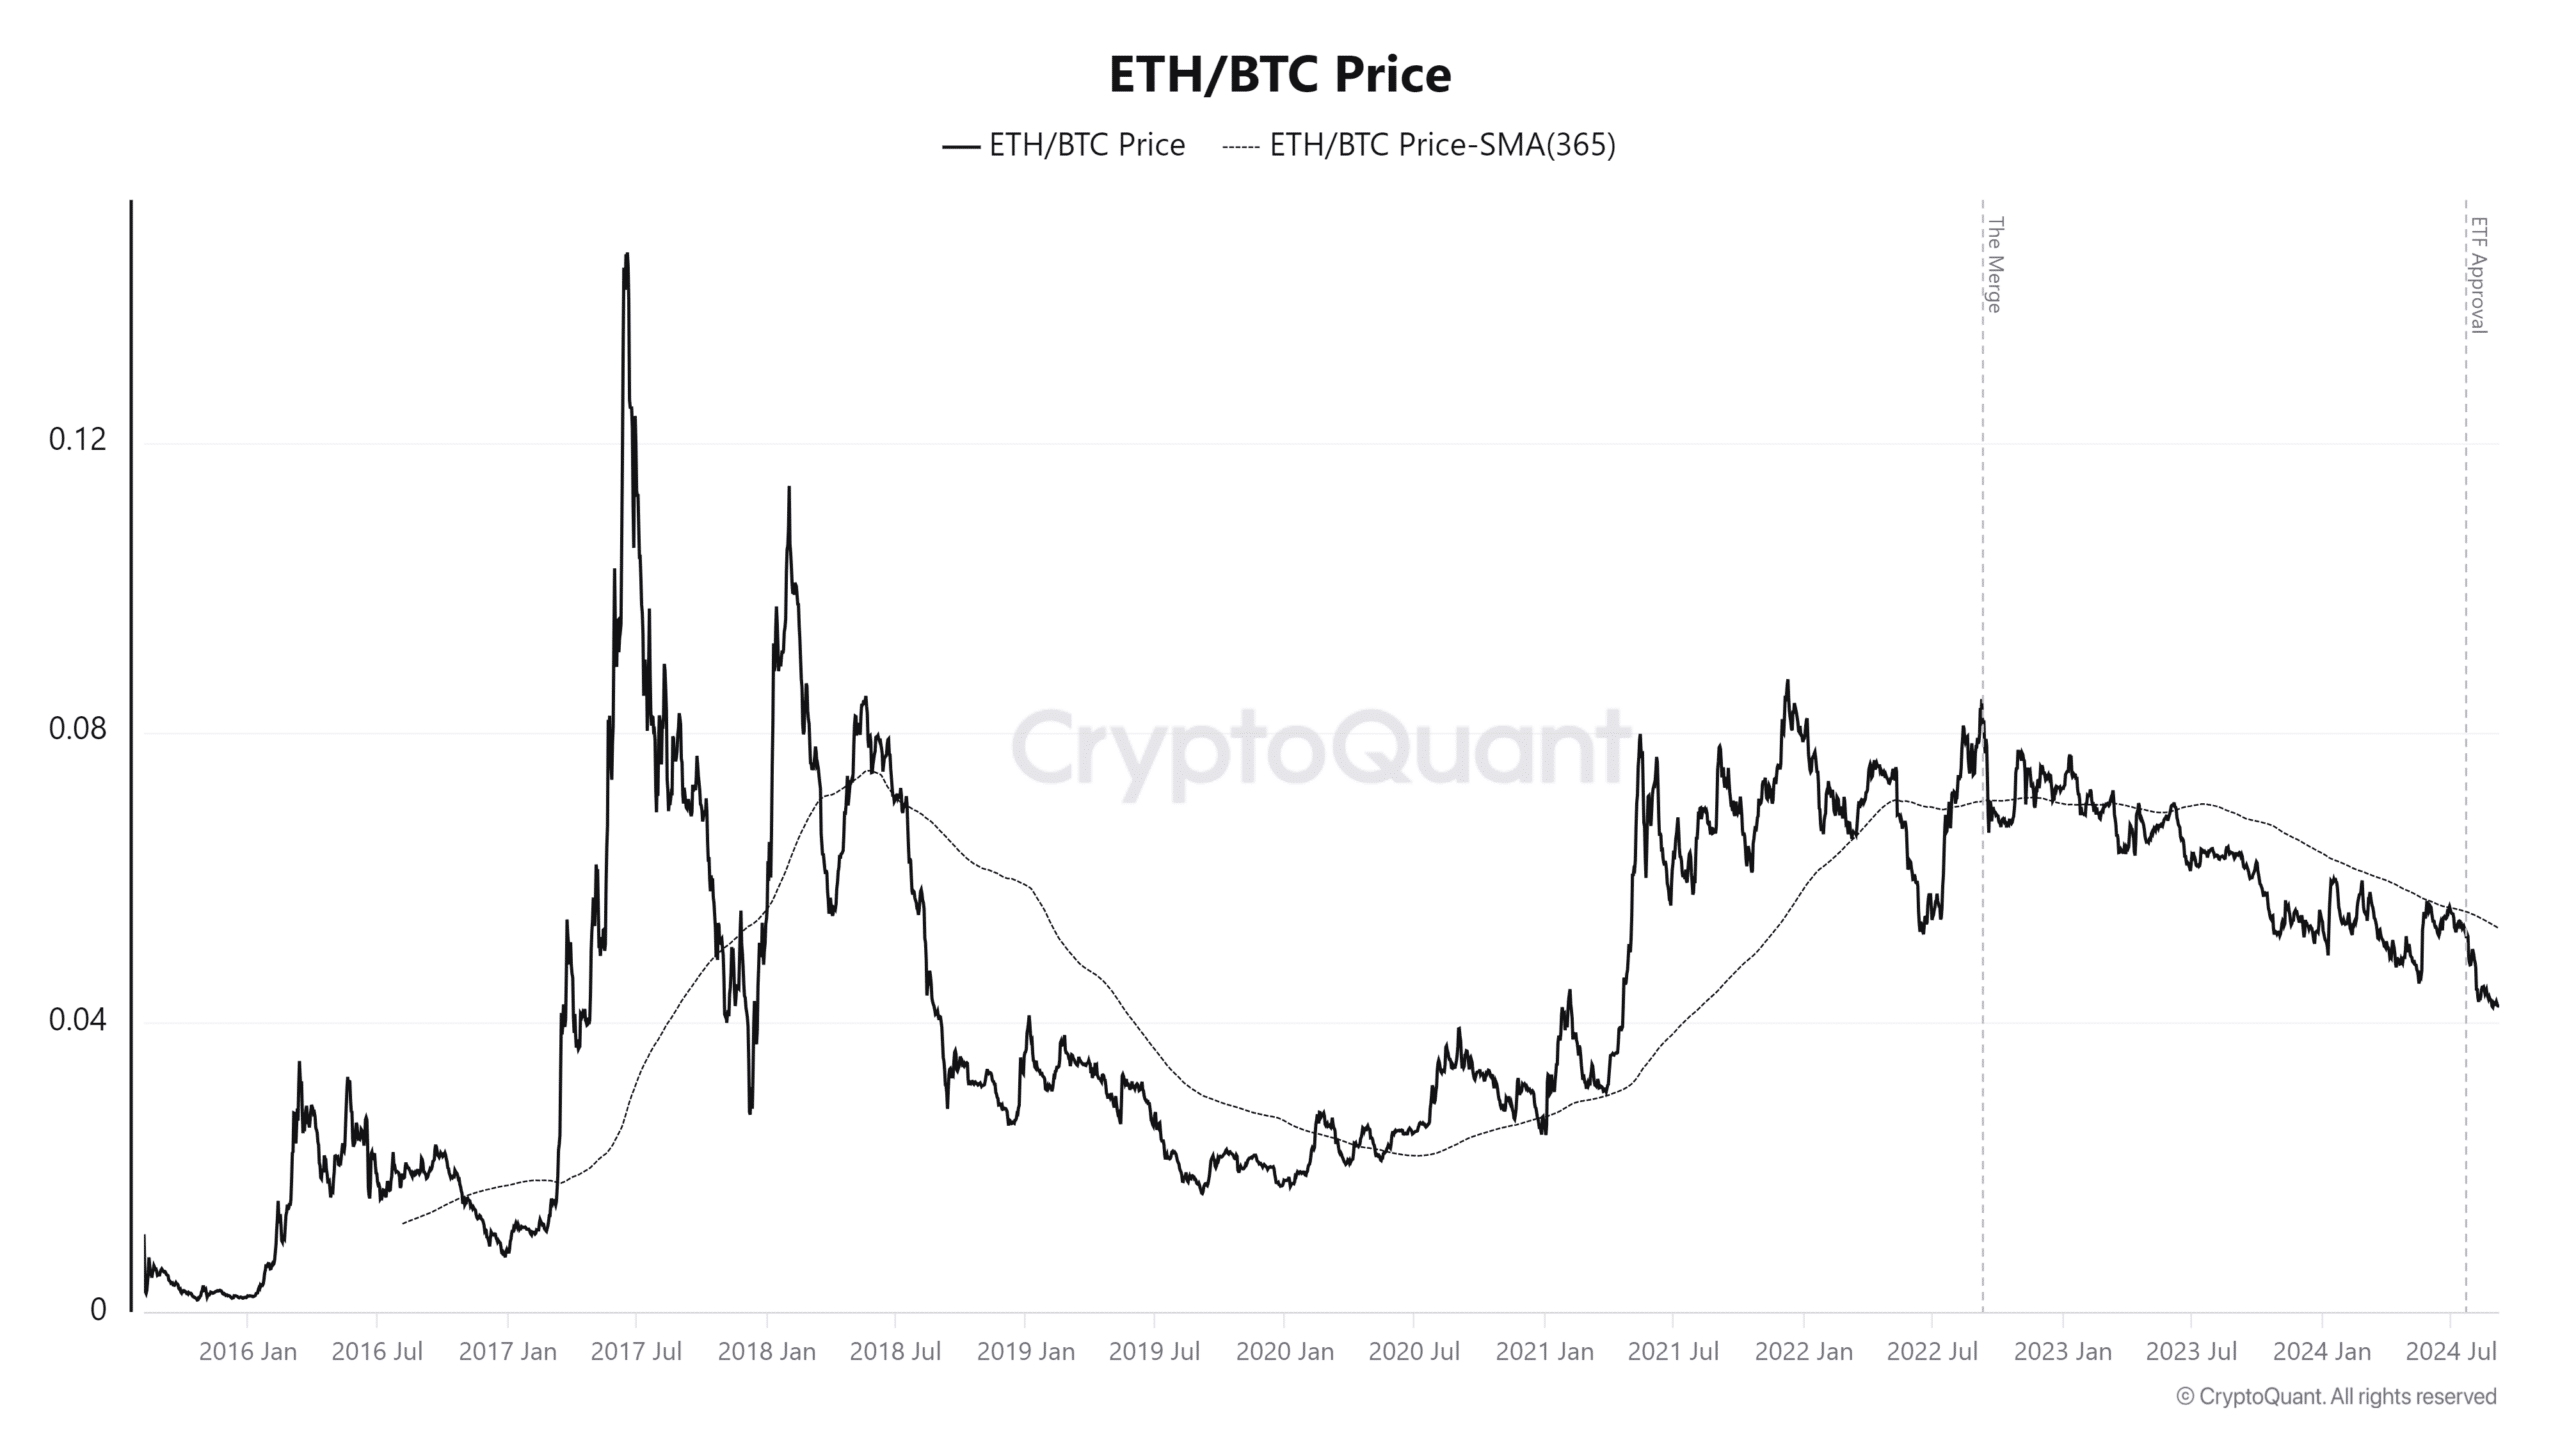
Source: CryptoQuant
The ETH/BTC price, at press time, stood at 0.0425, marking its lowest level since April 2021.
Despite the positive news of Spot ETF approvals for both assets in 2024 — Ethereum’s ETF being approved in July — The approval has done little to reverse ETH’s lack of performance against BTC.
Some reasons for the Ethereum/Bitcoin disparity
Ethereum and Bitcoin have noted contrasting trends in network fees and transaction activity over the past few months.
In fact, data showed that Ethereum’s fees have declined following its Dencun upgrade, contributing to decreased network activity. Additionally, Ethereum’s relative transaction count has dropped significantly, from a peak of 27 transactions per second in June 2021 to just 11 – Marking one of the lowest levels since July 2020.
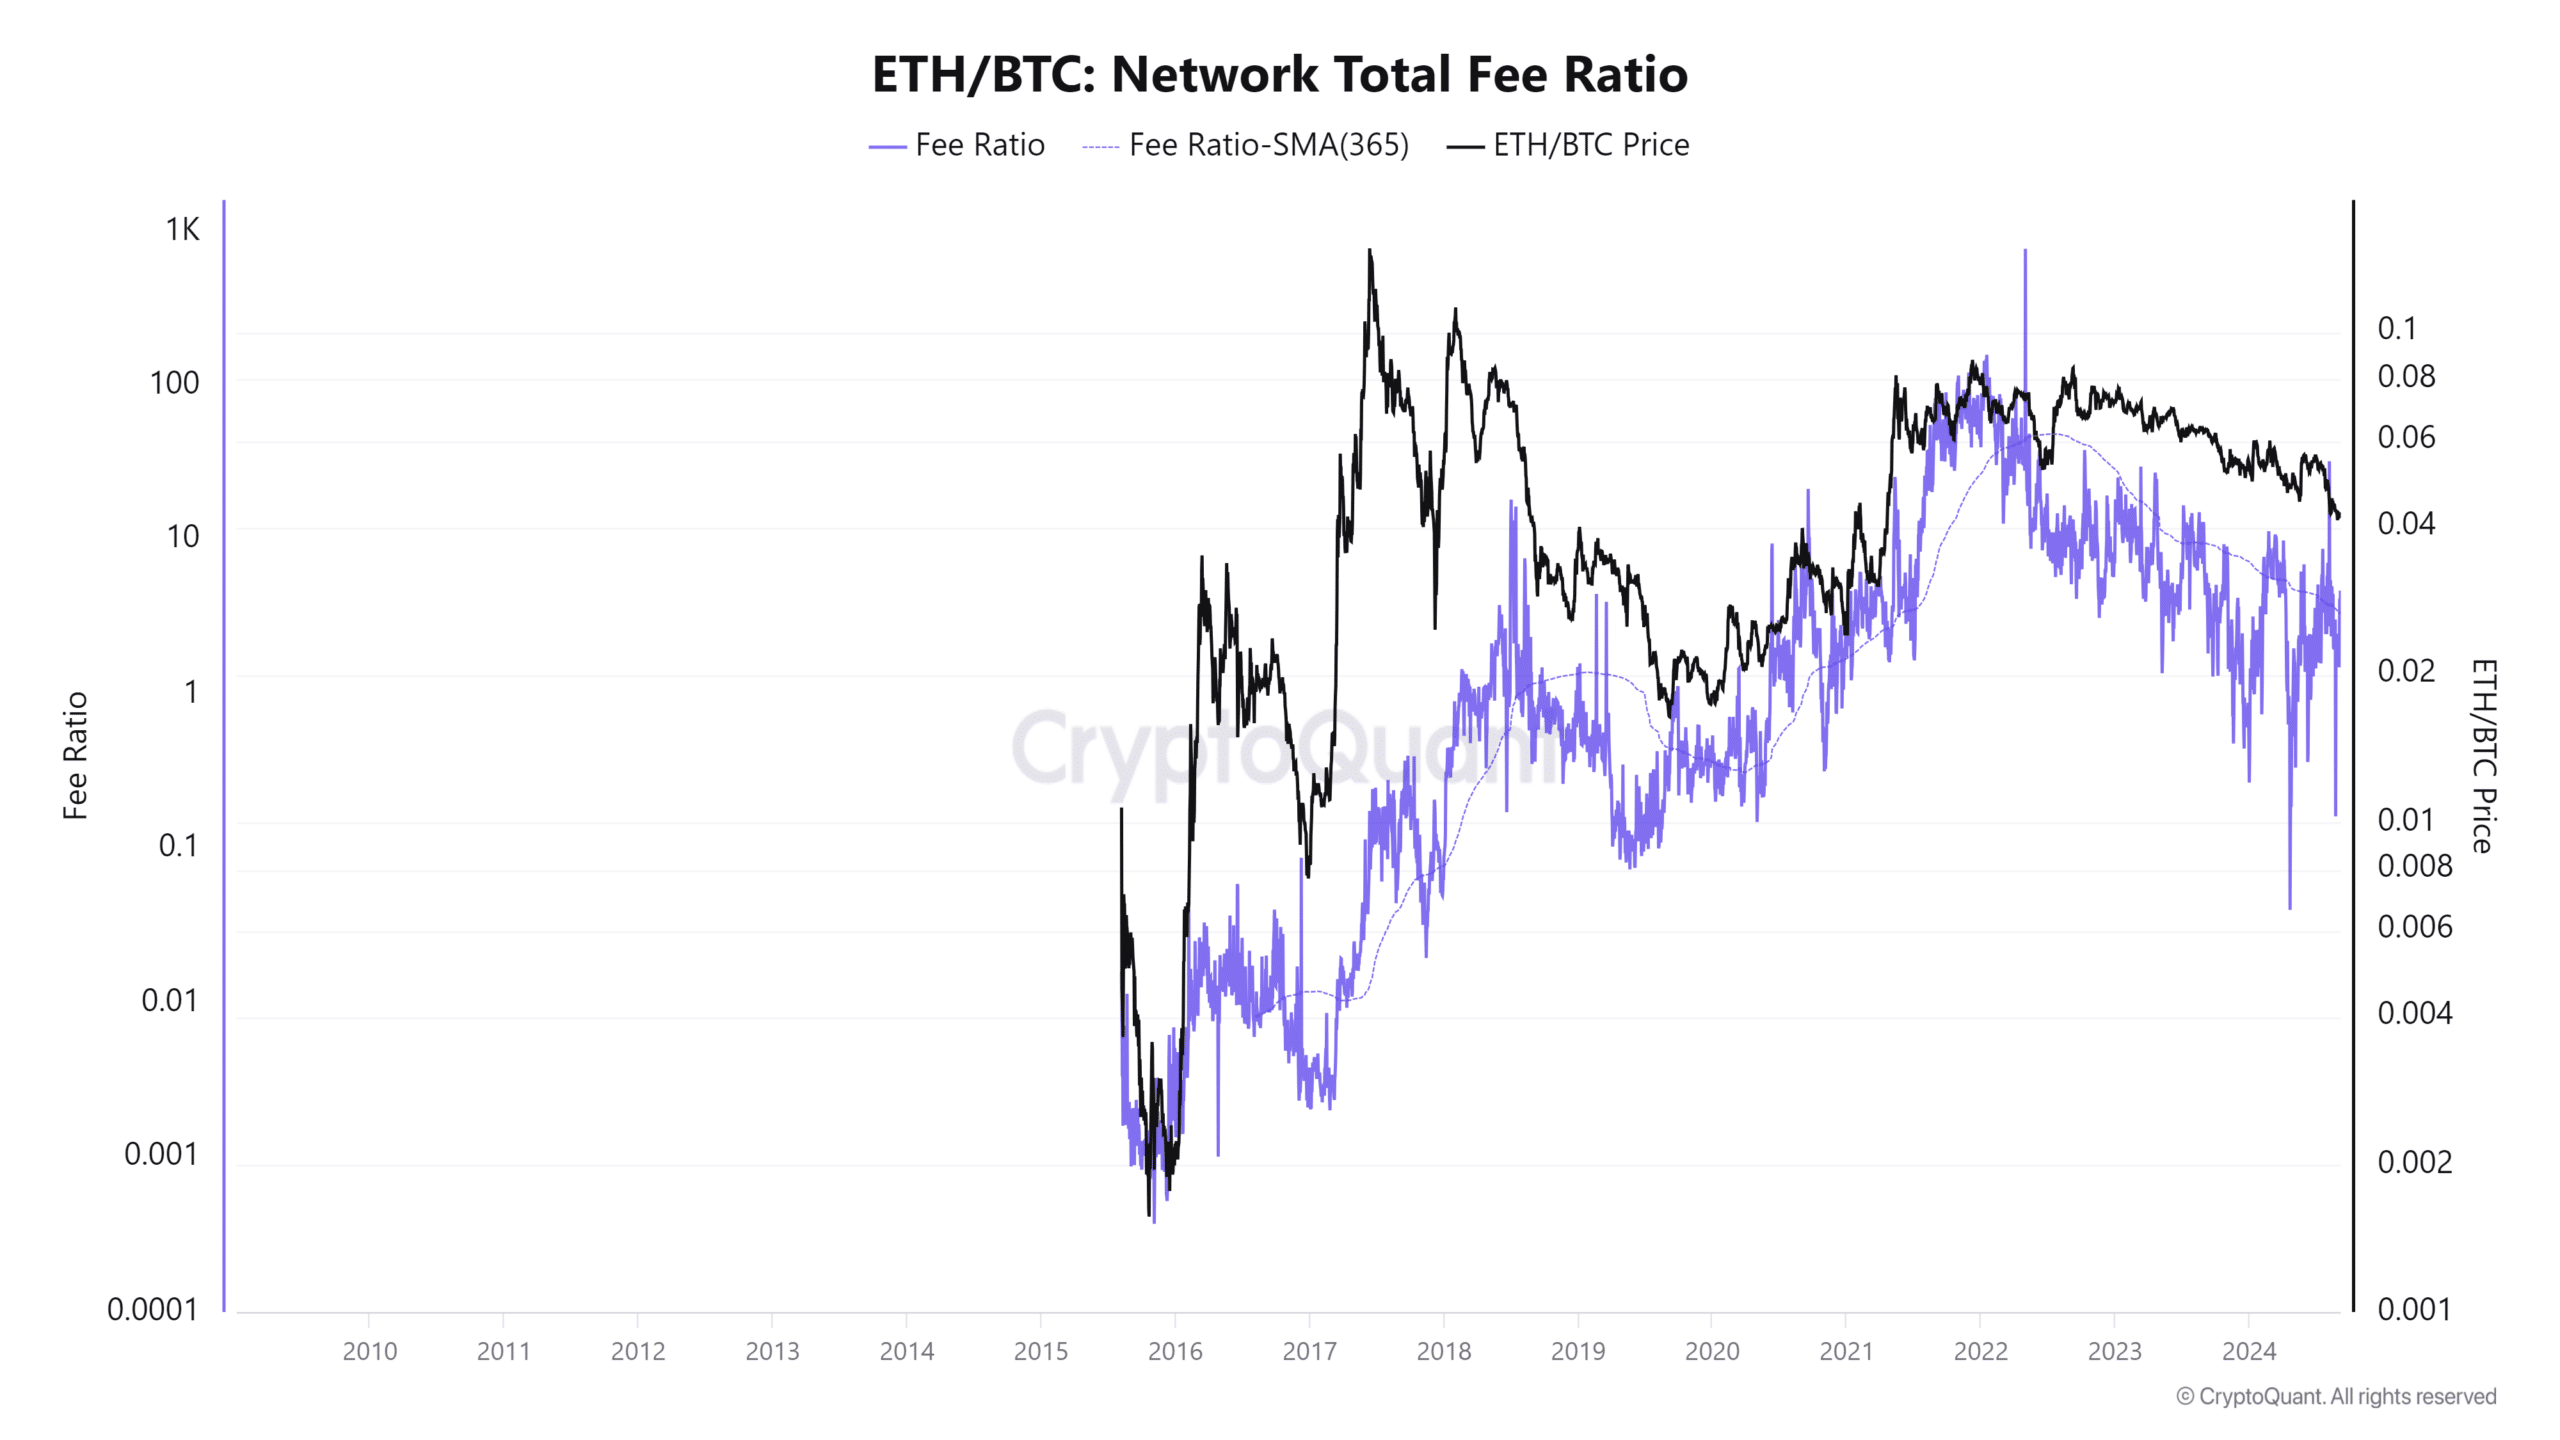
Source: CryptoQuant
On the contrary, Bitcoin has seen a spike in both fees and transactions in recent months. This has been driven primarily by the introduction of Inscriptions (related to Bitcoin Ordinals) and Runes. These developments have increased the demand for block space, contributing to the rise in transaction costs on the Bitcoin network.
The fall in Ethereum fees has also affected its burn rate, tied to its EIP-1559 mechanism. With lower fees, less ETH is being burned, reducing the deflationary pressure on the network and making Ethereum more inflationary.
This shift contrasts with earlier periods when high network fees led to a higher burn rate, reducing the overall ETH supply.
Analyzing the ETH/BTC two-year MVRV
Finally, an analysis of the two-year Market Value to Realized Value (MVRV) ratio for Ethereum and Bitcoin highlighted the growing disparity between the two assets.
At the time of writing, Ethereum’s MVRV stood slightly below zero at -1.16%, while Bitcoin’s MVRV was significantly higher at over 14%.
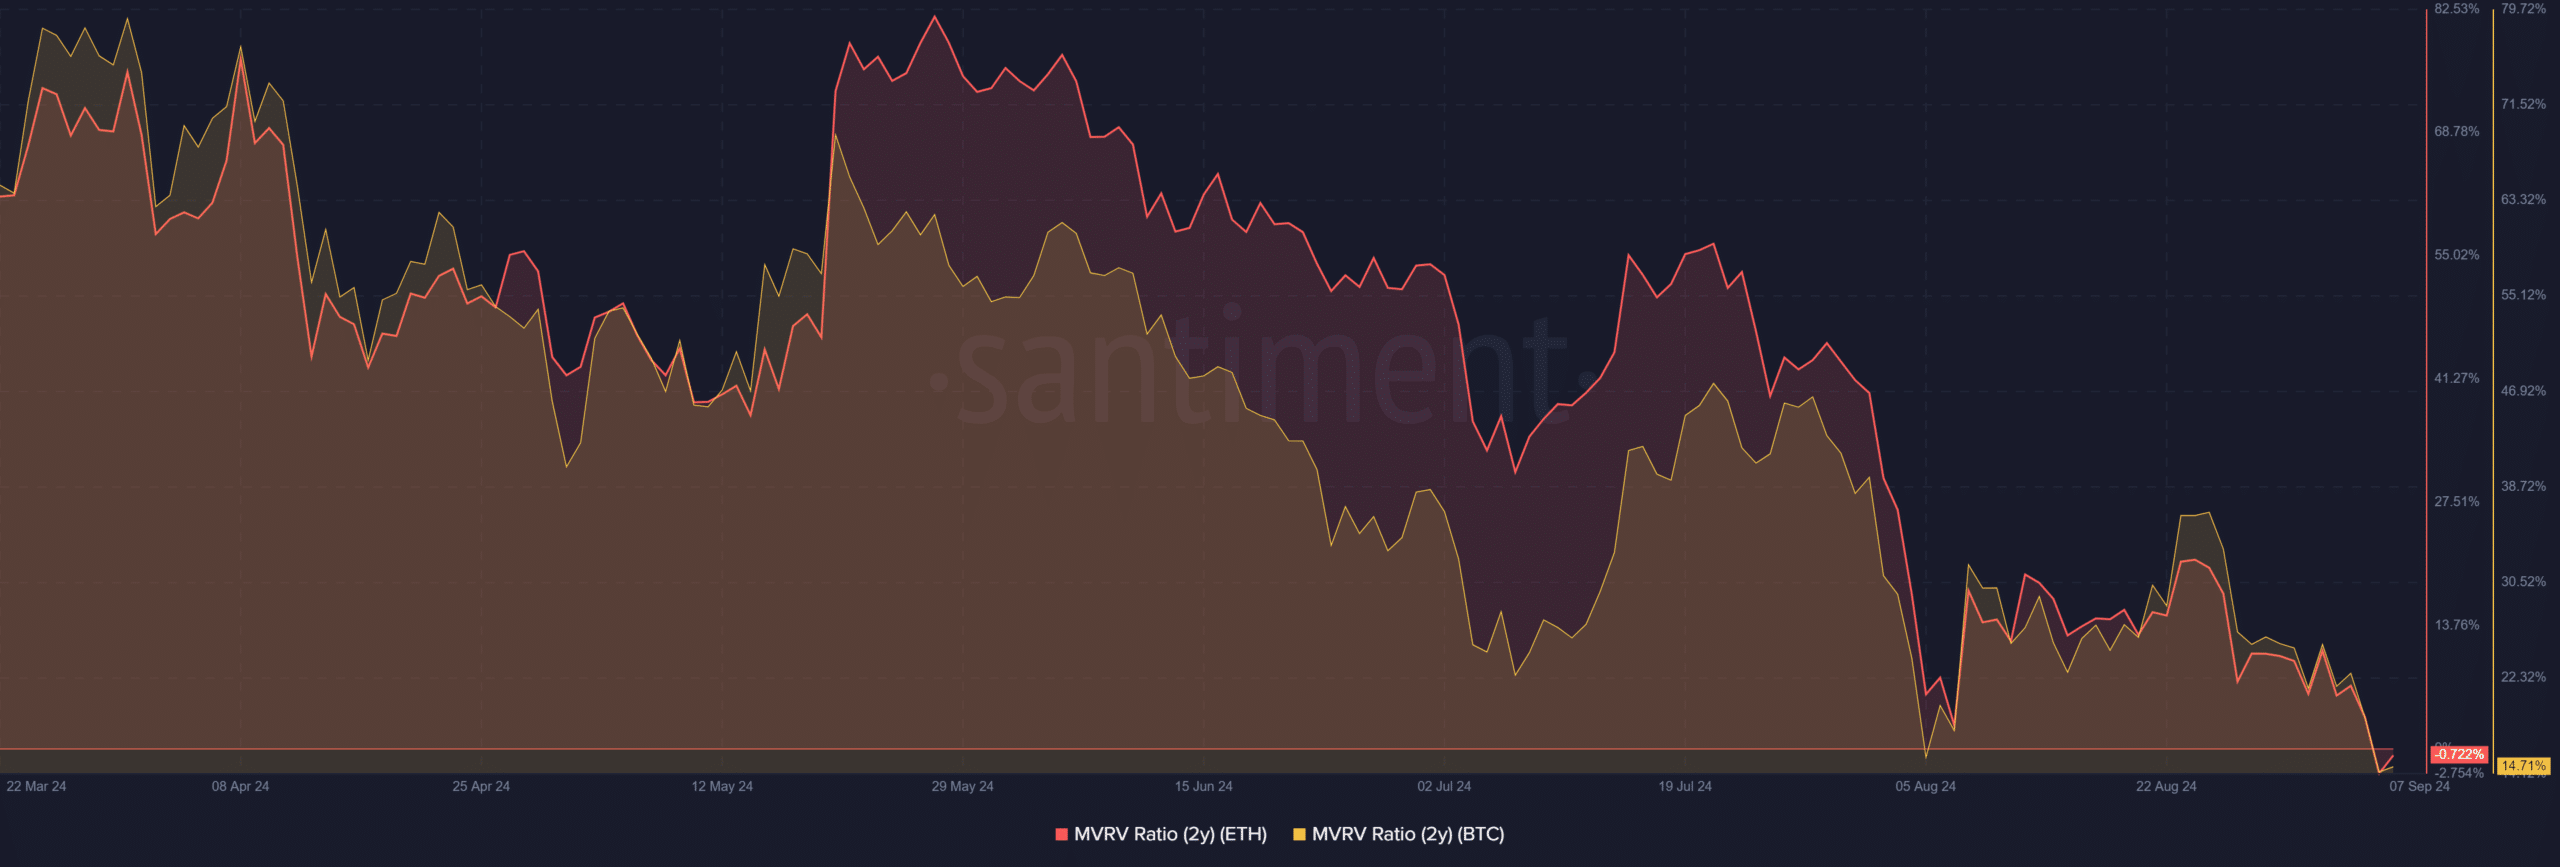
Source: Santiment
– Realistic or not, here’s ETH market cap in BTC’s terms
This disparity in MVRV ratios illustrates how much ETH has underperformed, compared to BTC.
Here, the MVRV ratio measures the profit or loss of holders based on the difference between the current market value and the realized value of an asset. In this case, BTC holders are sitting on over 14% profit, while ETH holders are recording a loss of over 1%.