On-chain data shows the Bitcoin whale entities have sold approximately $588 million in the cryptocurrency during the past week.
Bitcoin Whales Have Made Large Selling Moves Recently
As pointed out by analyst Ali Martinez in a new post on X, the BTC whales have sold around 10,000 BTC over the last seven days. The indicator of relevance here is the “Supply Distribution” from the on-chain analytics firm Santiment, which tells us about the total amount of Bitcoin that a given wallet group currently holds.
Related Reading
The addresses or investors are divided into these cohorts based on the number of tokens that they are carrying in their balance right now. A holder with 5 BTC, for instance, is put inside the 1 to 10 coins group.
In the context of the current topic, the whale cohort is of interest, which typically includes the addresses holding between 1,000 and 10,000 coins. At the current exchange rate, this range converts to $58.8 million at the lower end and $588 million at the upper one.
Clearly, the investors belonging to the group would be among the largest in the market, so the cohort can be considered to have some influence. As such, the behavior of the whales can be worth keeping an eye on.
Now, here is a chart that shows the trend in the Supply Distribution for this Bitcoin group over the past few months:

As displayed in the above graph, the Bitcoin supply held by the whales has observed a significant decline recently. More specifically, the investors belonging to the cohort have removed a combined 10,000 BTC from their wallets during this selloff, worth about $588 million right now.
From the chart, it’s visible that the sharpest selling came during the crash that BTC saw earlier, but these whales have also offloaded significant amounts in the recovery rally that has occurred over the last few days.
So far, the Supply Distribution of the cohort has shown no signs of a reversal, so it’s possible that the whales are still in net selling mode. Naturally, this could slow down the asset’s recovery efforts.
Nothing is set in stone, though, so the indicator could be used to monitor the coming days to see which direction these humongous investors really take. A net accumulation spree would suggest a renewal of confidence among the large hands and could pave the way for a further rise in the Bitcoin price.
Related Reading
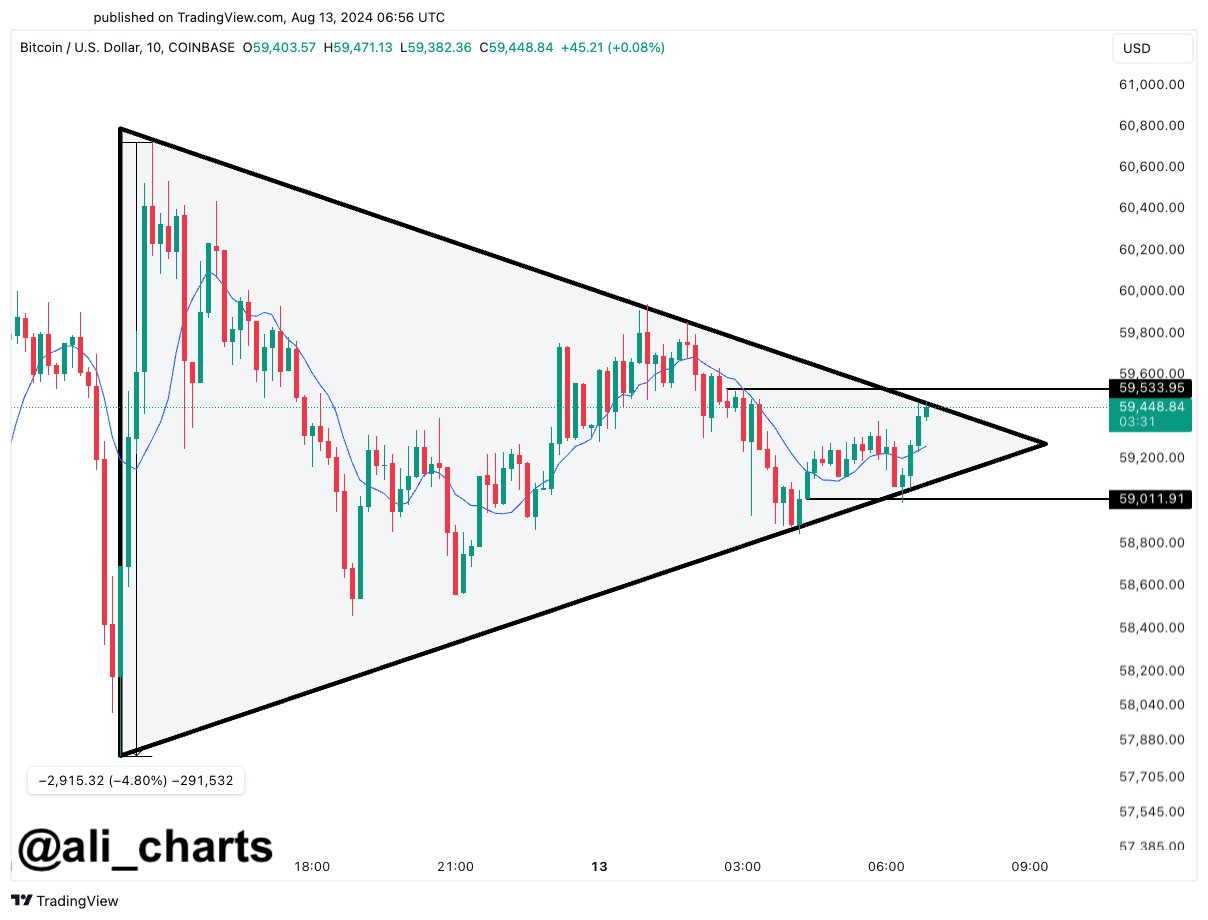
In some other news, BTC has been forming a symmetrical triangle pattern recently and is closing in on its apex, as the analyst has explained in another X post.

“Bitcoin is showing a symmetrical triangle on the lower time frames,” notes Martinez. “A sustained close outside the $59,000 – $59,530 range could trigger a 4.80% move for BTC.”
BTC Price
Bitcoin has struggled to put together bullish momentum in the last couple of days as its price has slumped to $58,800.
Featured image from Dall-E, Santiment.net, charts from TradingView.com


Leave a Reply