

- Bitcoin has dropped over 25% in the last four days.
- The liquidation volume rose to the highest since April.
In the last 24 hours, Bitcoin [BTC] has experienced a significant decline, dropping below the $60,000 price range. Given the current trend and the market’s volatility, could we see a further drop to the $40,000 price range?
Bitcoin drops 9% in 24 hours
AMBCrypto’s analysis of Bitcoin’s price trend highlighted a significant downturn over the last 24 hours, with a drop of over 9%.
Bitcoin was trading at approximately $52,900, with its decline hovering between 8% and 9% within this period.
Using the price range tool, it was evident that since the onset of the major decline around August 2nd, Bitcoin has experienced a substantial decrease in value, amounting to over 24%.
Bitcoin to $49,000
Using the Fibonacci retracement indicator to analyze Bitcoin’s price trend offered valuable insights into potential future movements.
Notably, if BTC’s price managed to hold above the 23.6% retracement level, it could ascend to test higher Fibonacci levels.
The chart showed it could specifically test the 38.2% level at approximately $56,847.56 or even the 50% level at about $59,127.13.
Conversely, if the downward trend persists, the next critical support, according to the Fibonacci retracement analysis, would be at the 0% level, around $49,467.88.
Additionally, the Relative Strength Index (RSI) analysis showed it was in oversold territory. Typically, this could indicate an imminent price reversal or bounce, as buyers might consider it an optimal point to enter the market.
However, it’s crucial to note that during strong downtrends, the RSI can remain in the oversold zone for extended periods.
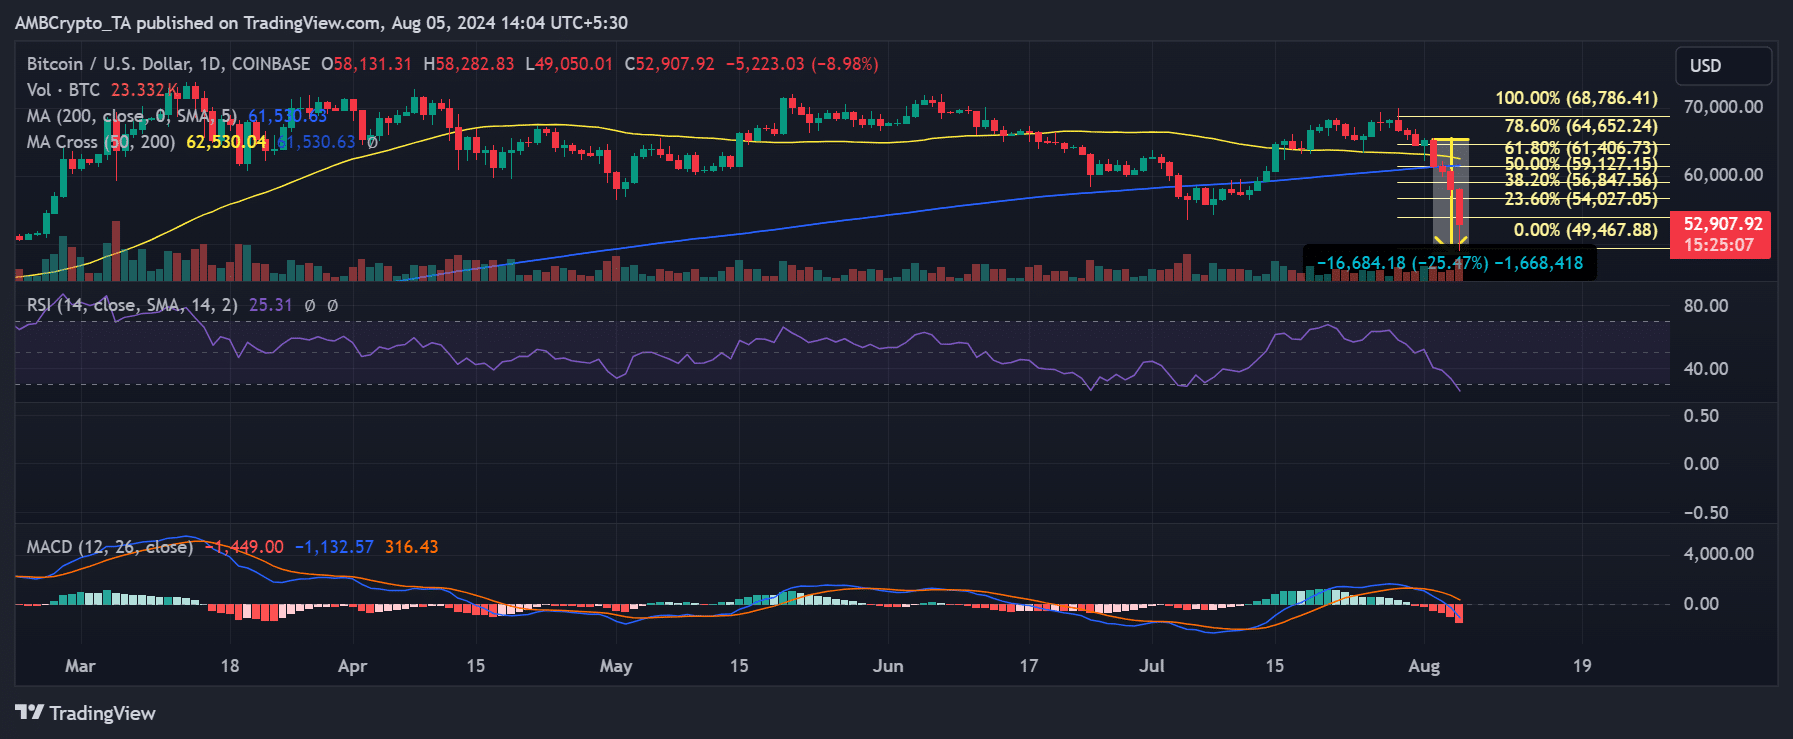
Source: TradingView
Additionally, the Moving Average Convergence Divergence (MACD), another momentum indicator, shows bearish momentum.
This suggests that the downtrend might extend in the short term, especially given that the price is already below the 23.6% Fibonacci level.
Considering these factors—the bearish MACD, the oversold RSI, and Bitcoin’s positioning relative to key Fibonacci levels—the short-term outlook for Bitcoin appears to be bearish.
Liquidation hits highest point in months
The analysis of Bitcoin’s liquidation volume on Coinglass indicated a significant spike, marking its highest point since April.
At the close of trading on the 4th of August, the total BTC liquidation volume reached over $246 million.
A closer examination of these figures revealed that most liquidations were long positions, totaling over $200 million. In comparison, short liquidations accounted for more than $46 million.
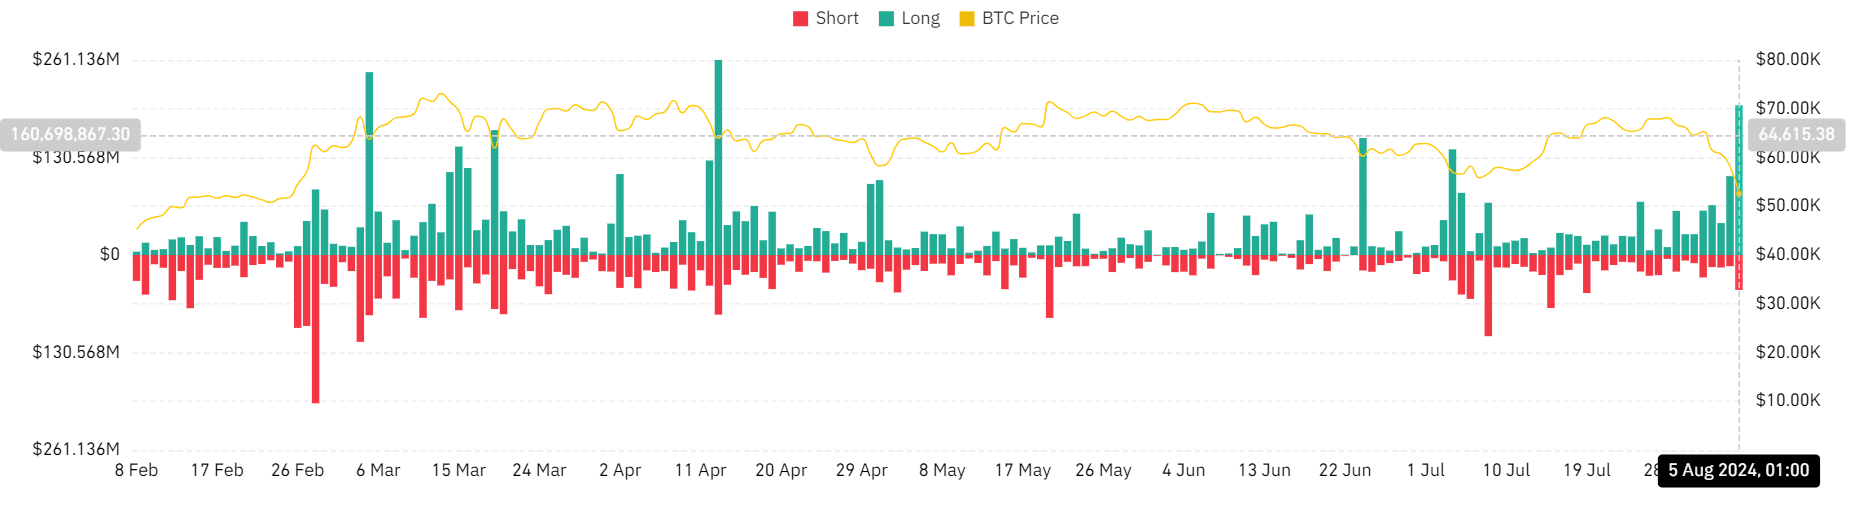
Source: Coinglass
Read Bitcoin’s [BTC] Price Prediction 2024-25
This substantial increase in liquidation volume, particularly in long positions, was a reaction to the sharp price movement that caught many traders off guard.
This likely triggered stop-loss orders or liquidating leveraged positions. The prevalence of long liquidations indicates that many traders were optimistic or bullish on BTC’s price, anticipating upward movements that did not materialize as expected.