

- Despite the recent price decline, BTC’s number of long-term holders increased.
- In case of a bullish takeover, then BTC might first reclaim $68k.
Bitcoin [BTC] registered a major drop in the last 24 hours as it failed to retest its all-time high, which several expected. However, in the past few hours, BTC has somewhat consolidated near $66.
Let’s have a look at Bitcoin liquidation heatmap to find out its upcoming targets.
Bitcoin’s recent downfall
CoinMarketCap’s data revealed that BTC’s price dropped by over 4% in the last 24 hours. At the time of writing, the king coin was getting comfortable near $66k with a market capitalization of over $1.31 trillion.
AMBCrypto’s look at IntoTheBlock’s data revealed that despite the recent setback, BTC’s number of long-term holders (addresses holding BTC for more than 1 year) was increasing.
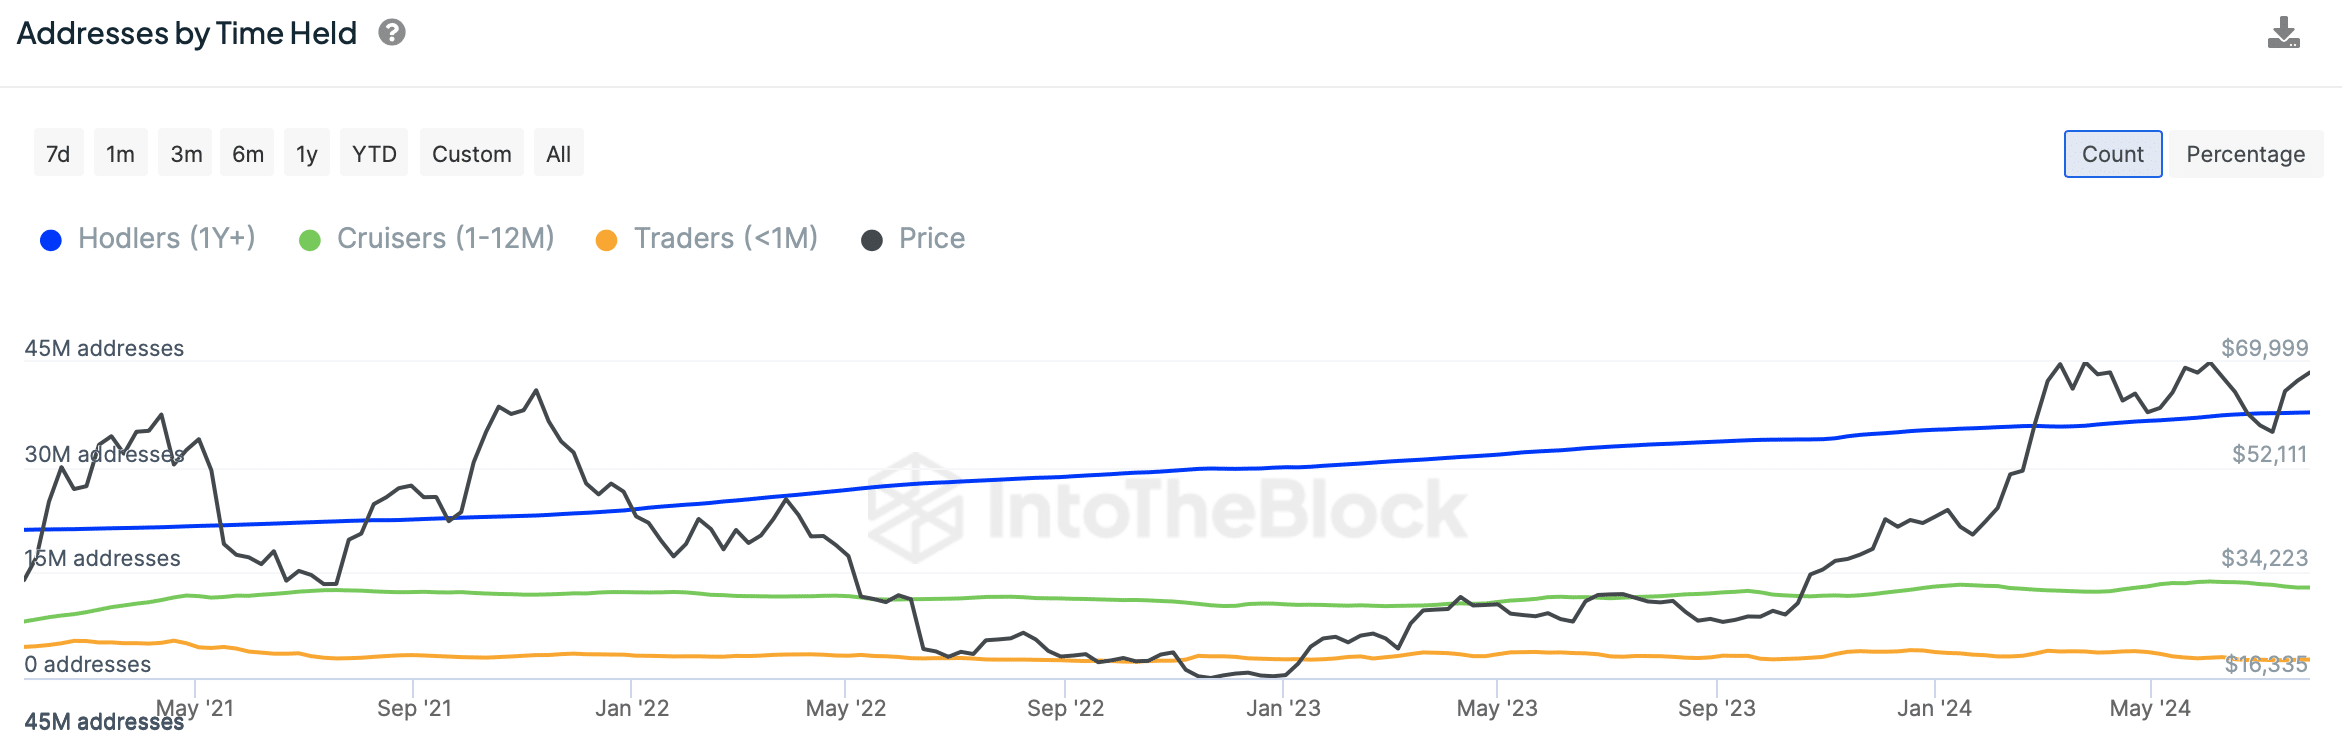
Source: IntoTheBlock
AMBCrypto’s look at CryptoQuant’s data revealed that its binary CDD was green. This meant that long-term holders’ movement in the last seven days was lower than the average. They have a motive to hold their coins.
Another bullish metric was the funding rate, which increased. However, not everything was in BTC’s favor.
For instance, as per Coinglass’ data, BTC’s long/short ratio registered a massive dip. A drop in the market suggested that there are more short positions in the market than long positions.
This indicated that bearish sentiment around the king of cryptos has increased.
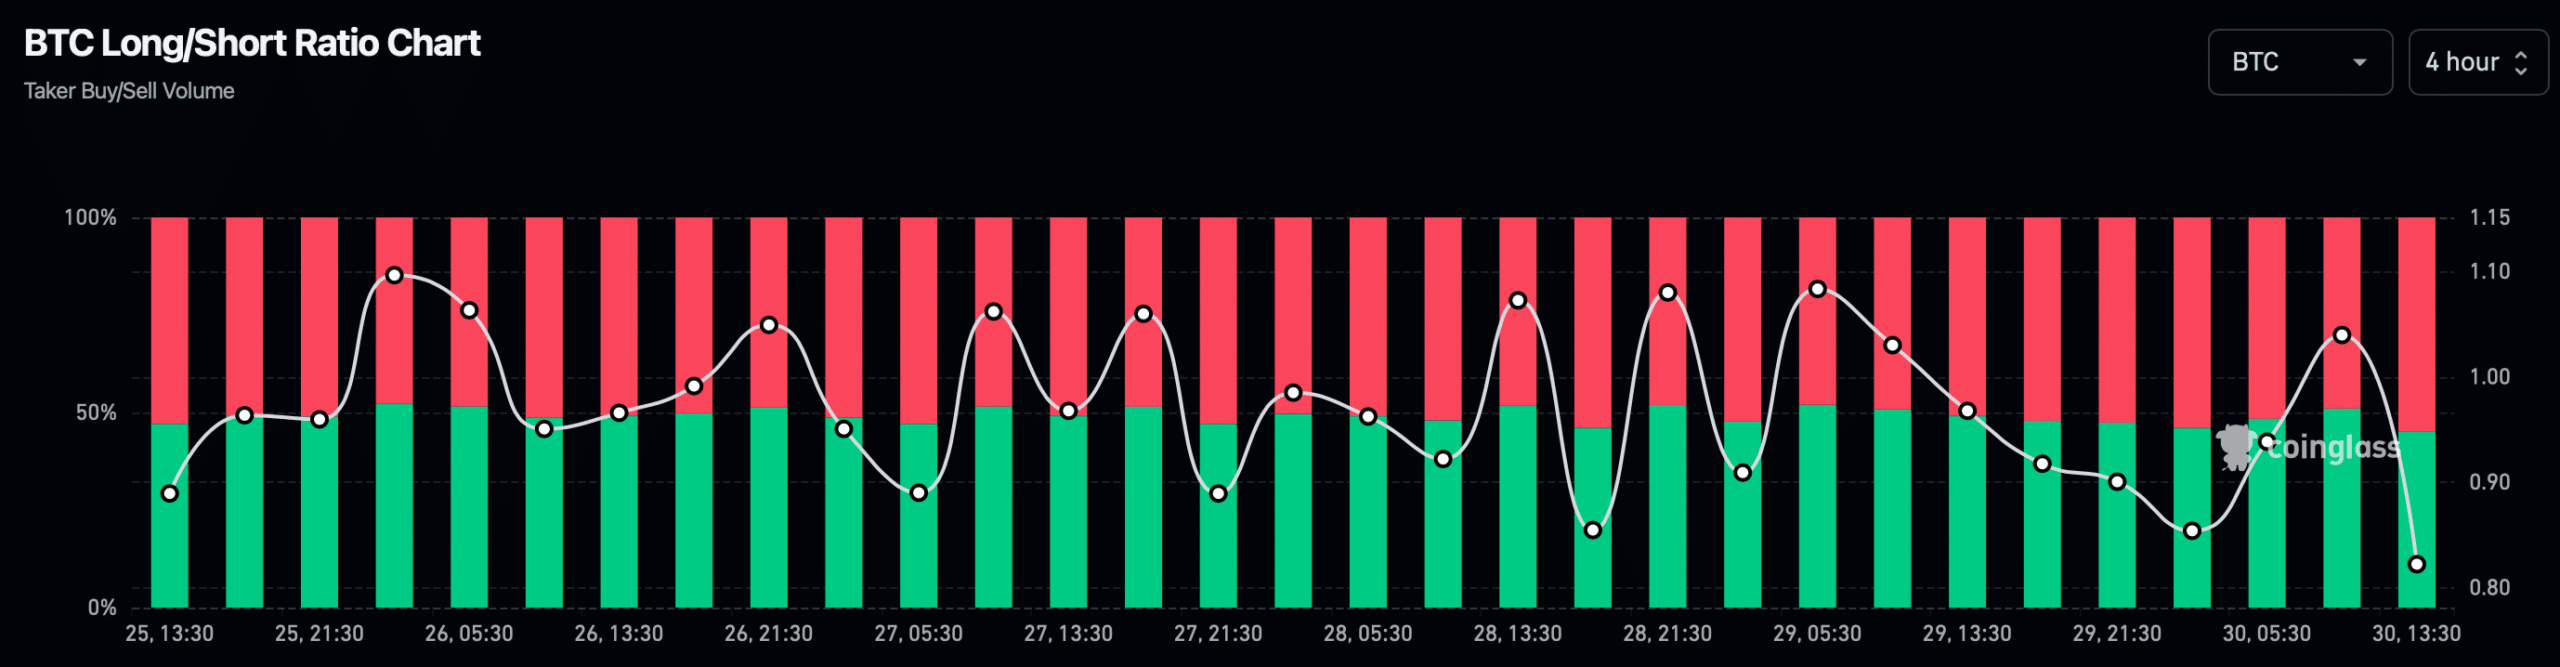
Source: Coinglass
Upcoming targets for BTC
AMBCrypto then checked BTC’s daily chart to see which way BTC was headed in the coming days. The Relative Strength Index (RSI) took a sideways path, hinting at a few more days of consolidation.
The technical indicator MACD also had a similar reading as it displayed the possibility of a bearish crossover.
Nonetheless, the Bollinger Bands revealed that BTC was about to test its 20-day Simple Moving Average (SMA). Bitcoin might as well manage to successfully test the support as the Chaikin Money Flow (CMF) registered an uptick.
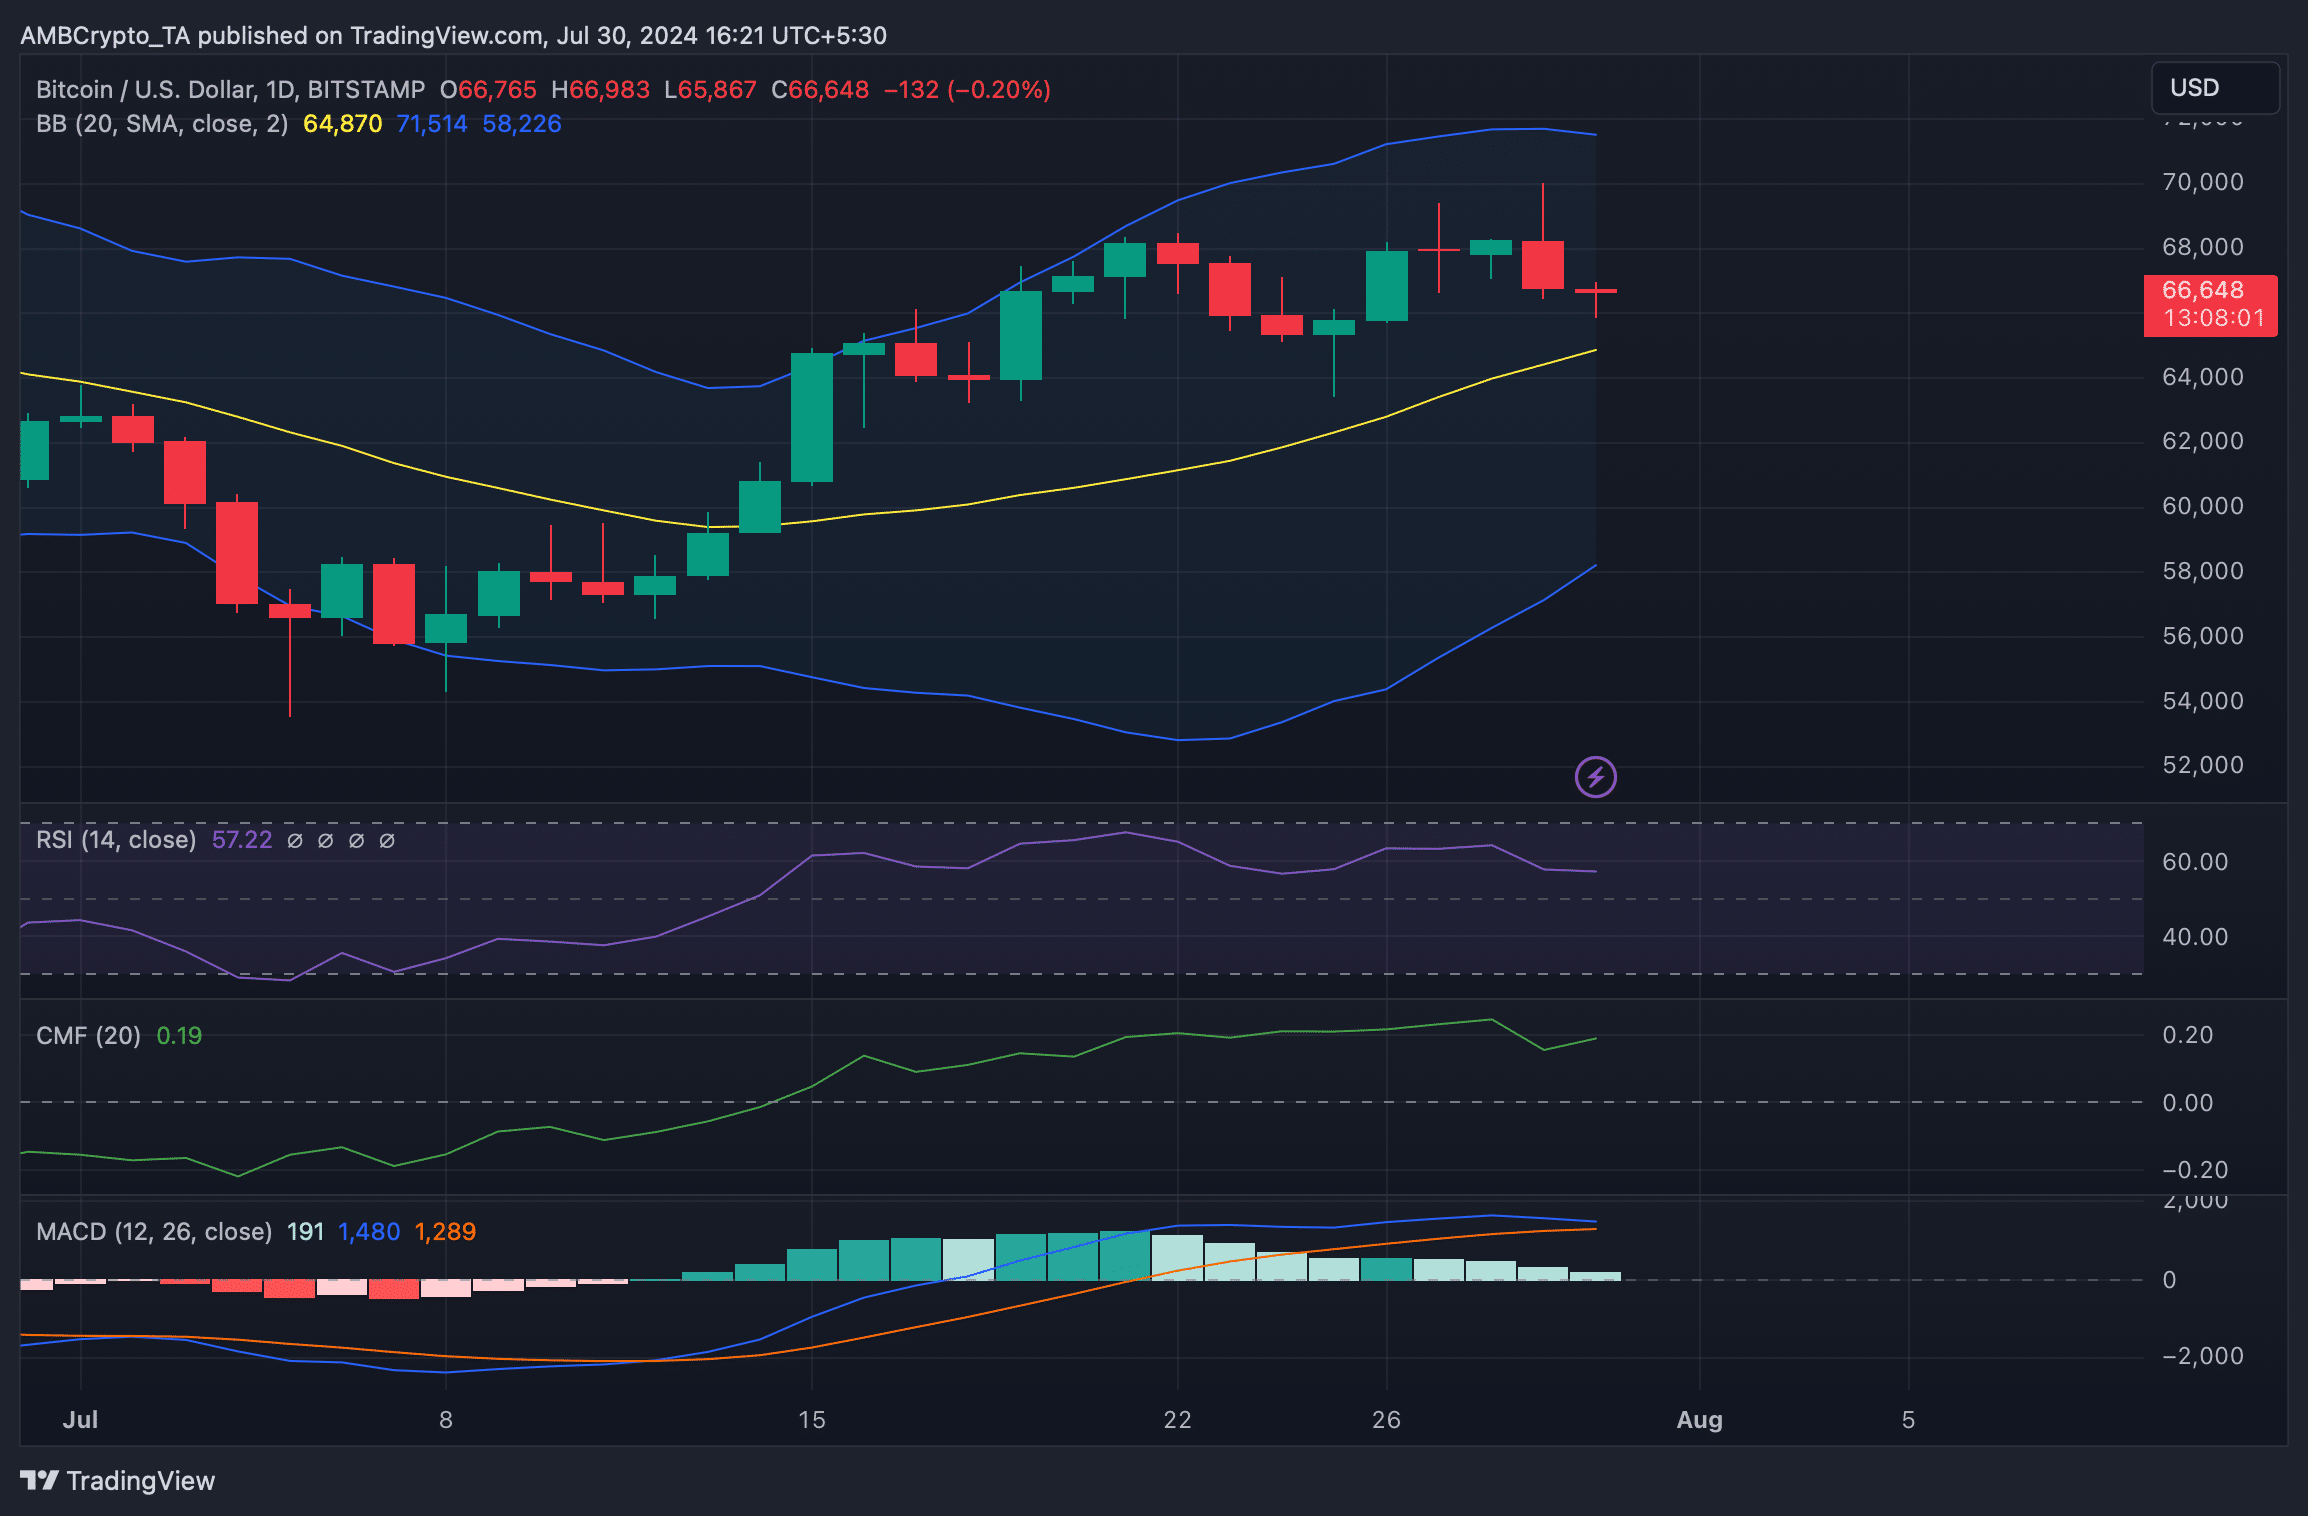
Source: TradingView
We then took a look at Bitcoin liquidation heatmap to find out its upcoming targets. If the bear rally continues, then it won’t be surprising for BTC to drop to $65k first as liquidation would rise.
A further plummet under that might push BTC down to near the $60k range.
Read Bitcoin’s [BTC] Price Prediction 2024-25
However, in case of a trend reversal, BTC might reclaim $68k before it eyes at retesting its ATH.
If BTC manages to retest its ATH, then it would be interesting to see whether it can go above that.
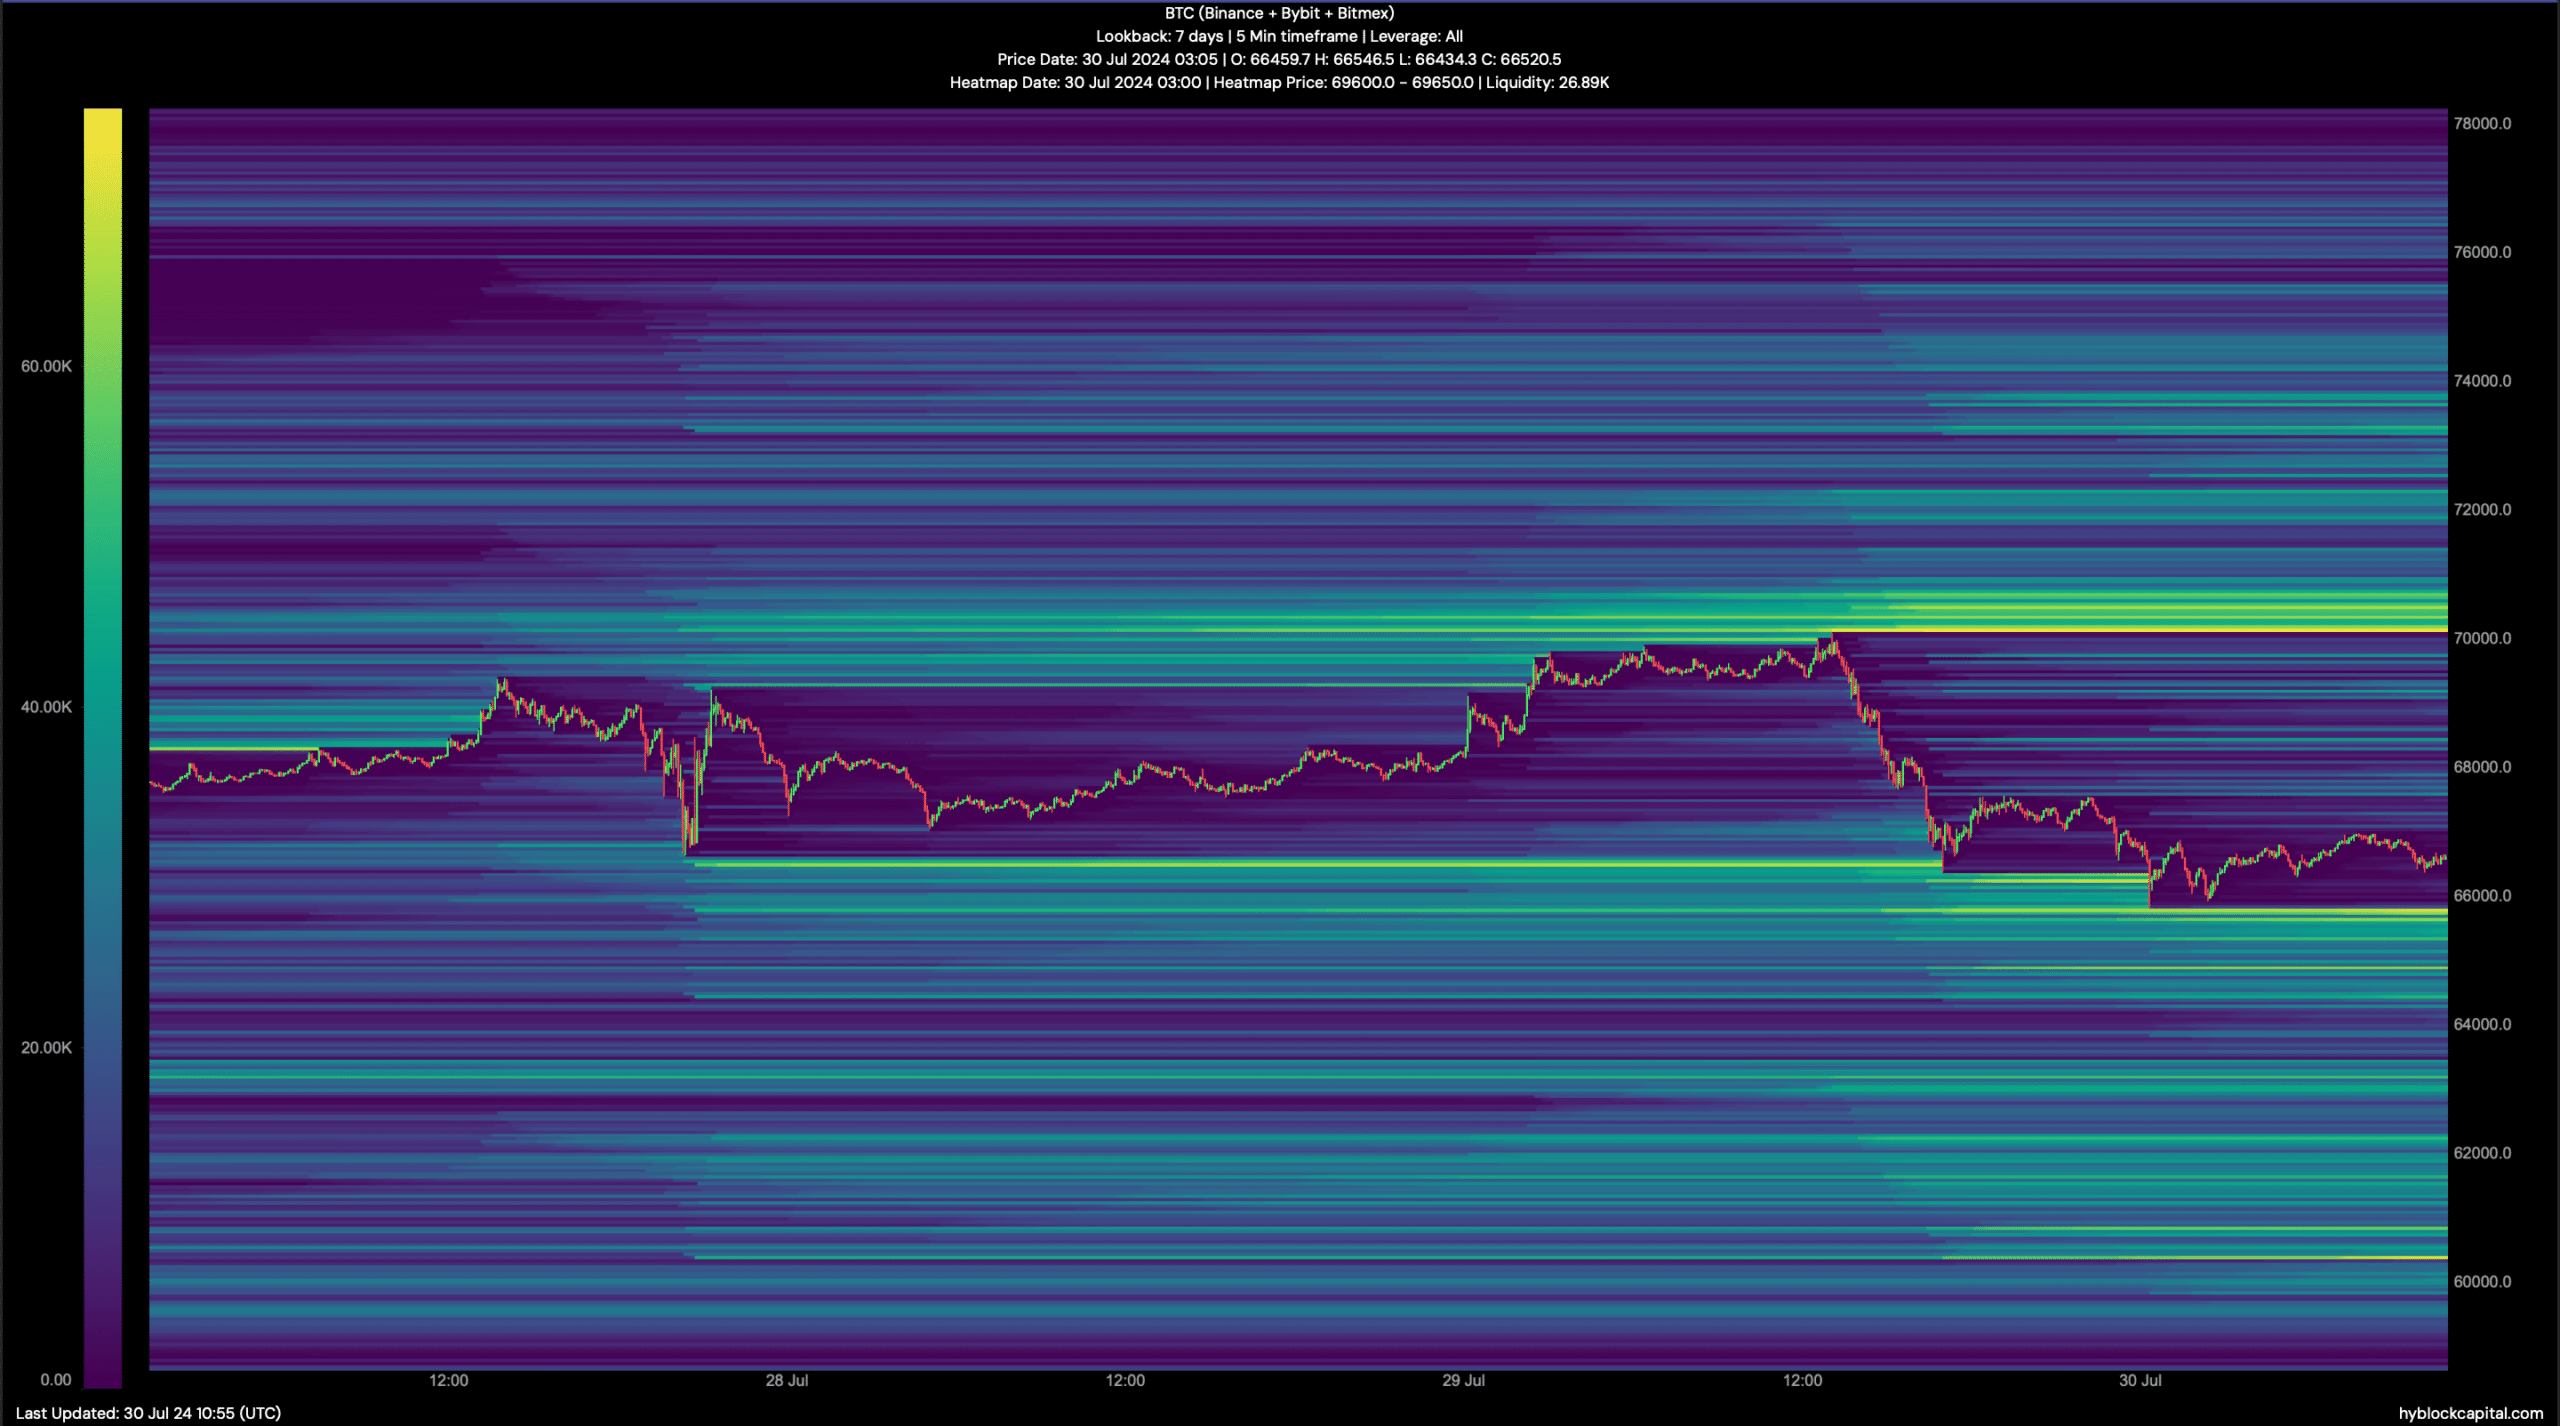
Source: Hyblock Capital