

- Despite a few integrations, Polkadot development activity dropped.
- DOT’s long/short ratio increased, hinting at a bullish takeover.
Polkadot [DOT] had a rough week as the bears clearly remained dominant in the market. Meanwhile, Polkadot Insider, a popular X handle that gives updates related to the blockchain’s ecosystem, posted a tweet revealing a few notable developments regarding the DOT ecosystem.
Polkadot’s weekly performance
CoinMarketCap’s data revealed that Polkadot’s price witnessed an 8% decline in the last seven days. At the time of writing, DOT was trading at $5.81 with a market capitalization of over $8.3 billion, making it the 15th largest crypto.
This negative price action also had an impact on its weighted sentiment, which dropped. A decline in the metric suggests that bearish sentiment around the token was dominant in the market.
Nonetheless, its social volume remained high, reflecting its popularity in the crypto space.
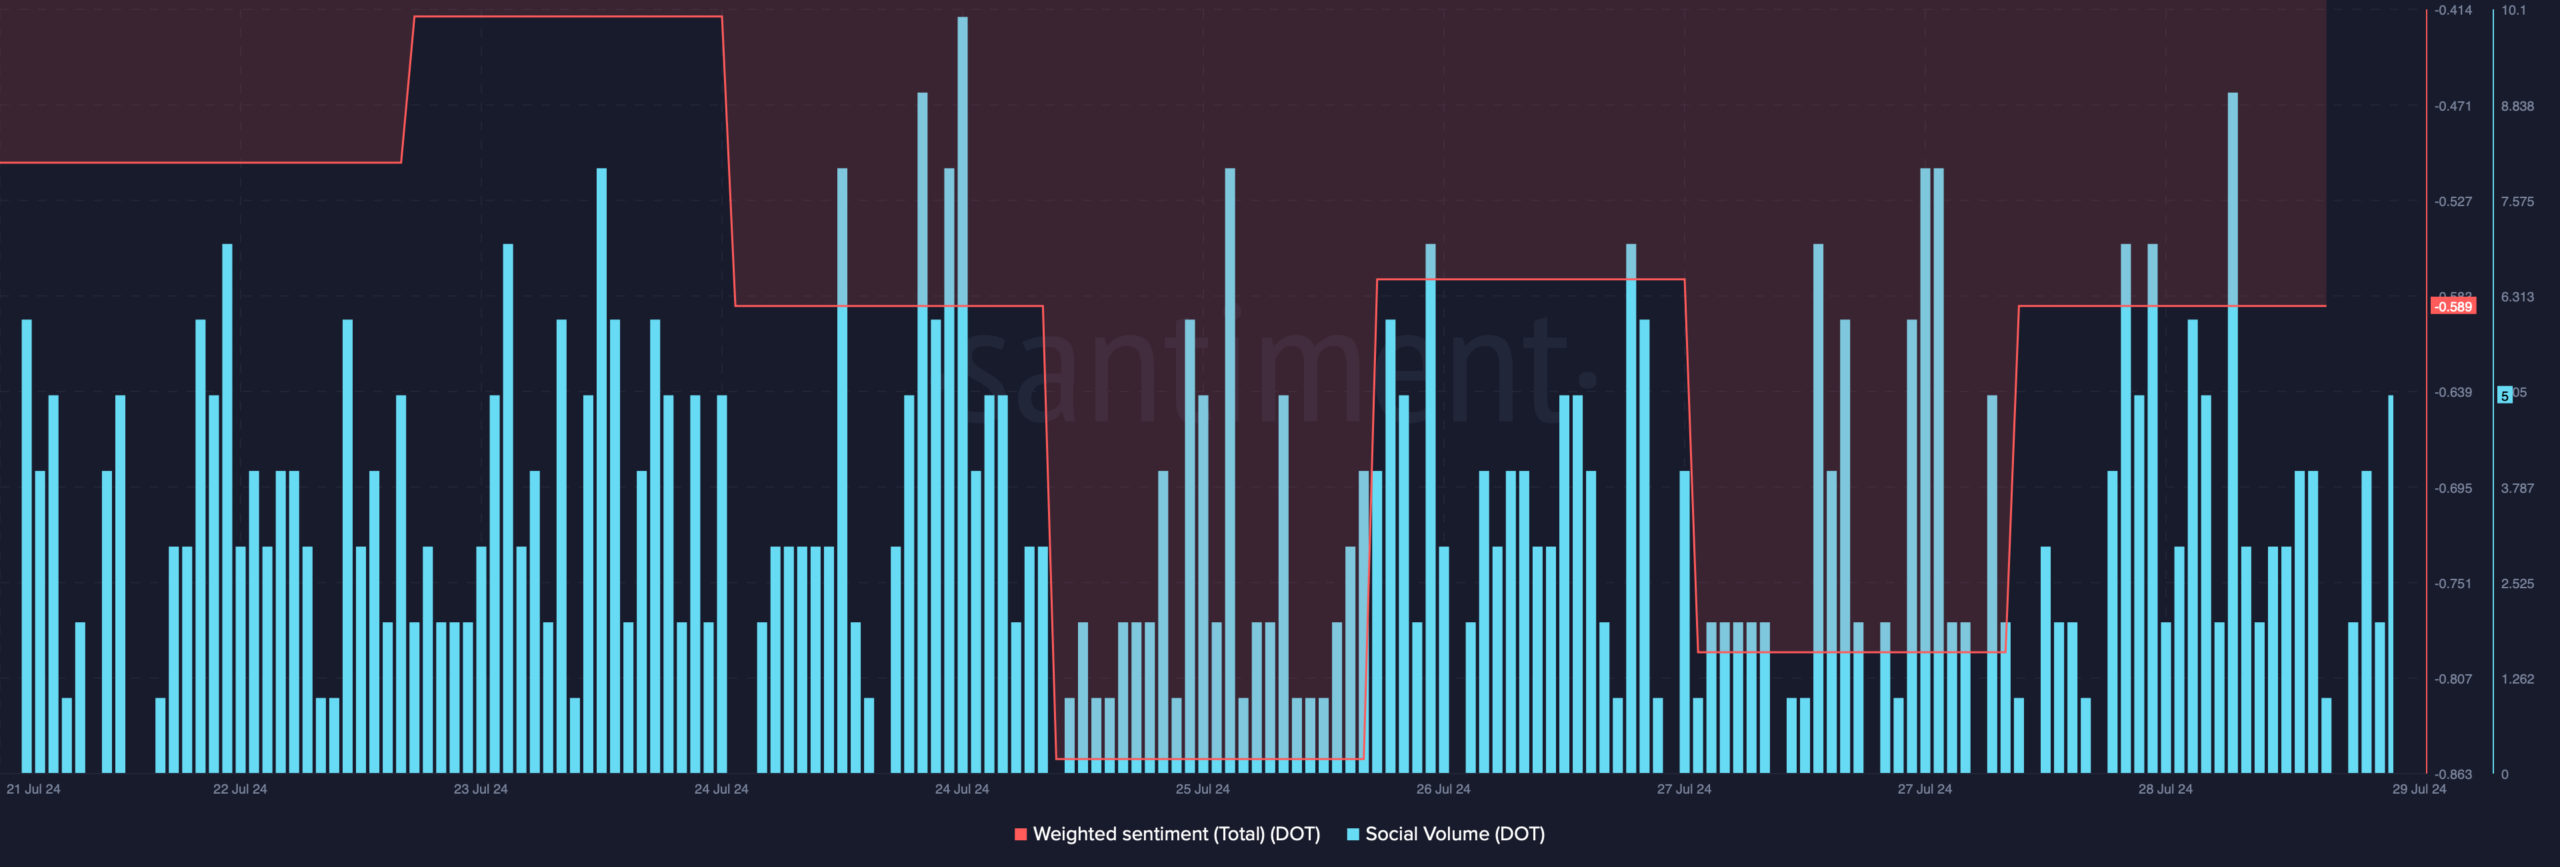
Source: Santiment
While the token’s price dropped, several new integrations happened.
As per Polkadot Insiders’ tweet, over the last 72 hours, Band Protocol was integrated on Astar Network’s ink. The blockchain also released its Polkadot-decoded 2024 recap—future version.
However, it was surprising to note that despite these integrations, DOT’s development activity declined last week. A similar declining trend was also noted in terms of DOT’s development activity contributor count.
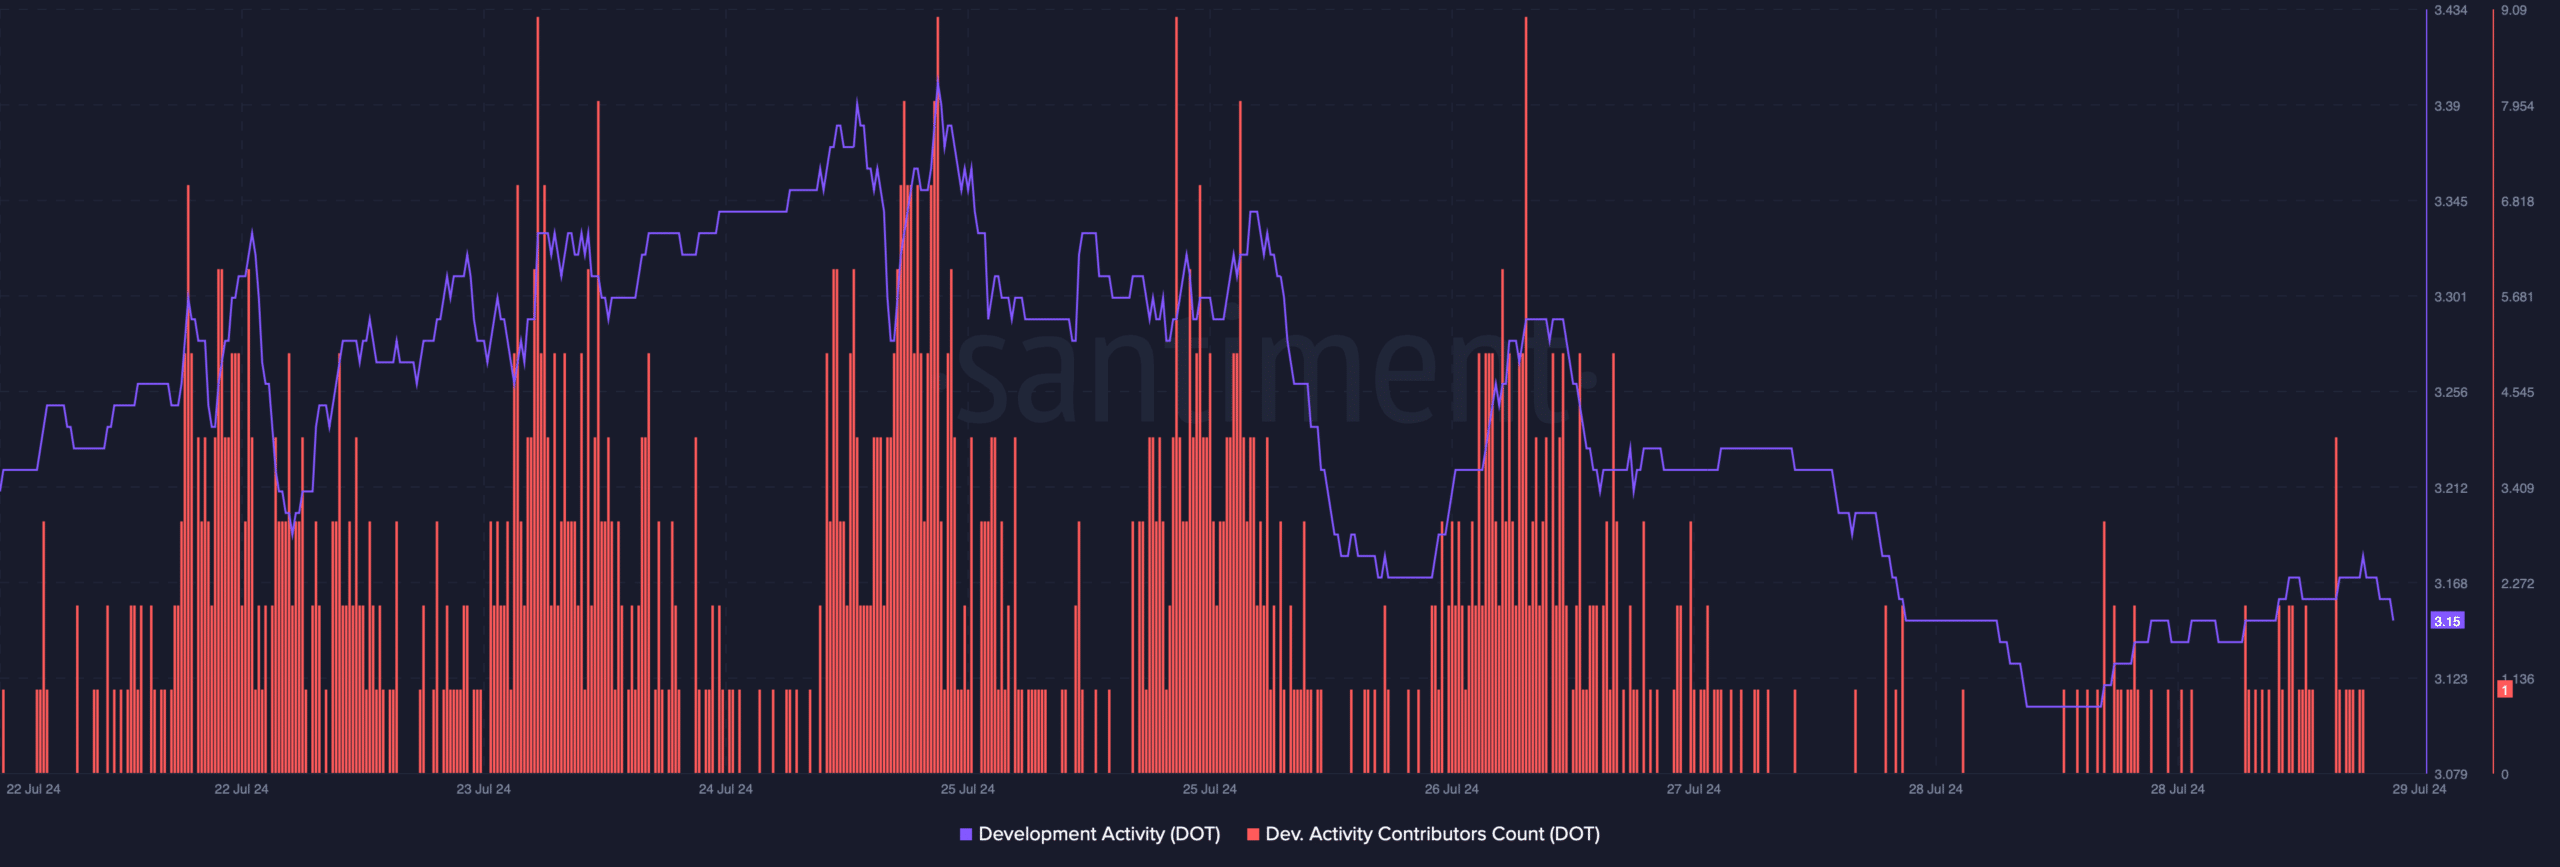
Source: Santiment
What to expect now from DOT?
AMBCrypto then planned to have a look at Polkadot’s on-chain data daily chart to find out whether the bearish price trend would continue in the coming days.
According to our analysis of Coinglass’ data, DOT’s long/short ratio registered a sharp increase. A rise in the metric means that there are more long positions in the market than short positions, which can be considered a bullish signal.
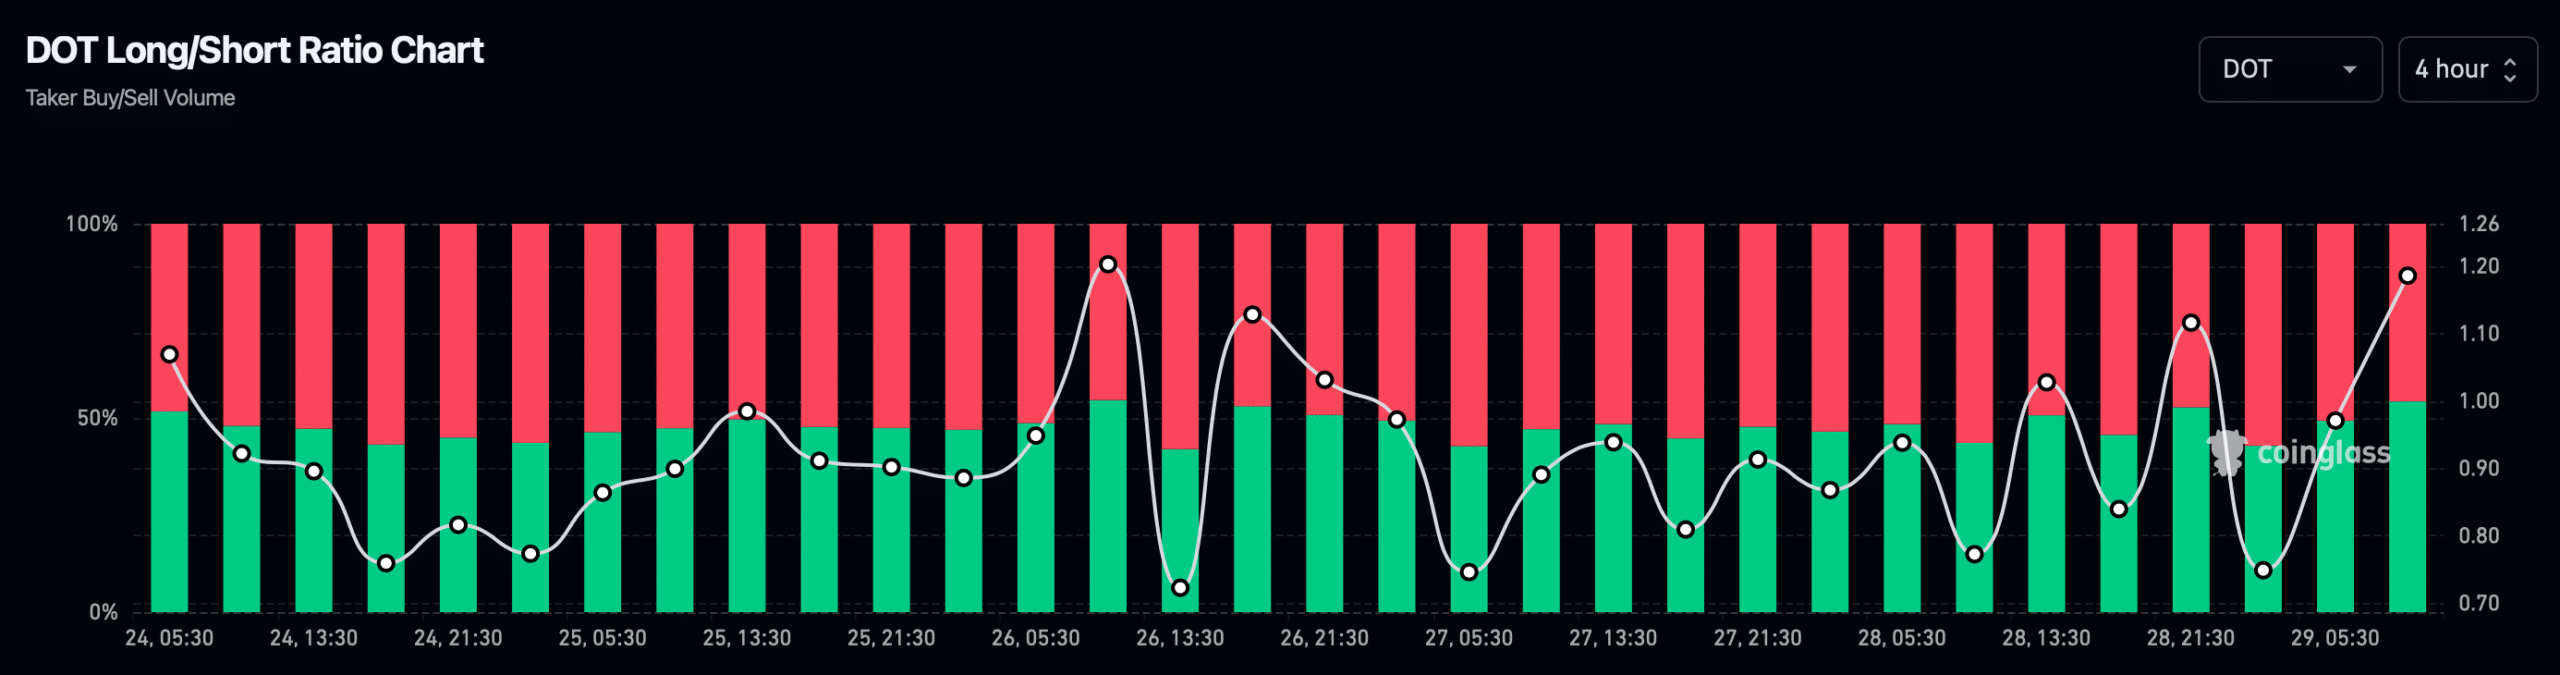
Source: Coinglass
However, the token’s open interest remained somewhat stable while its price dropped, hinting that it might take a bit longer for DOT to change the on-going market trend. The technical indicator MACD displayed a bearish crossover.
On top of that, the Relative Strength Index (RSI) continued to remain under the neutral mark, further suggesting that there were chances of a few slow-moving days.
Nonetheless, Polkadot’s price had touched the lower limit of the Bollinger Bands, which often results in price upticks.
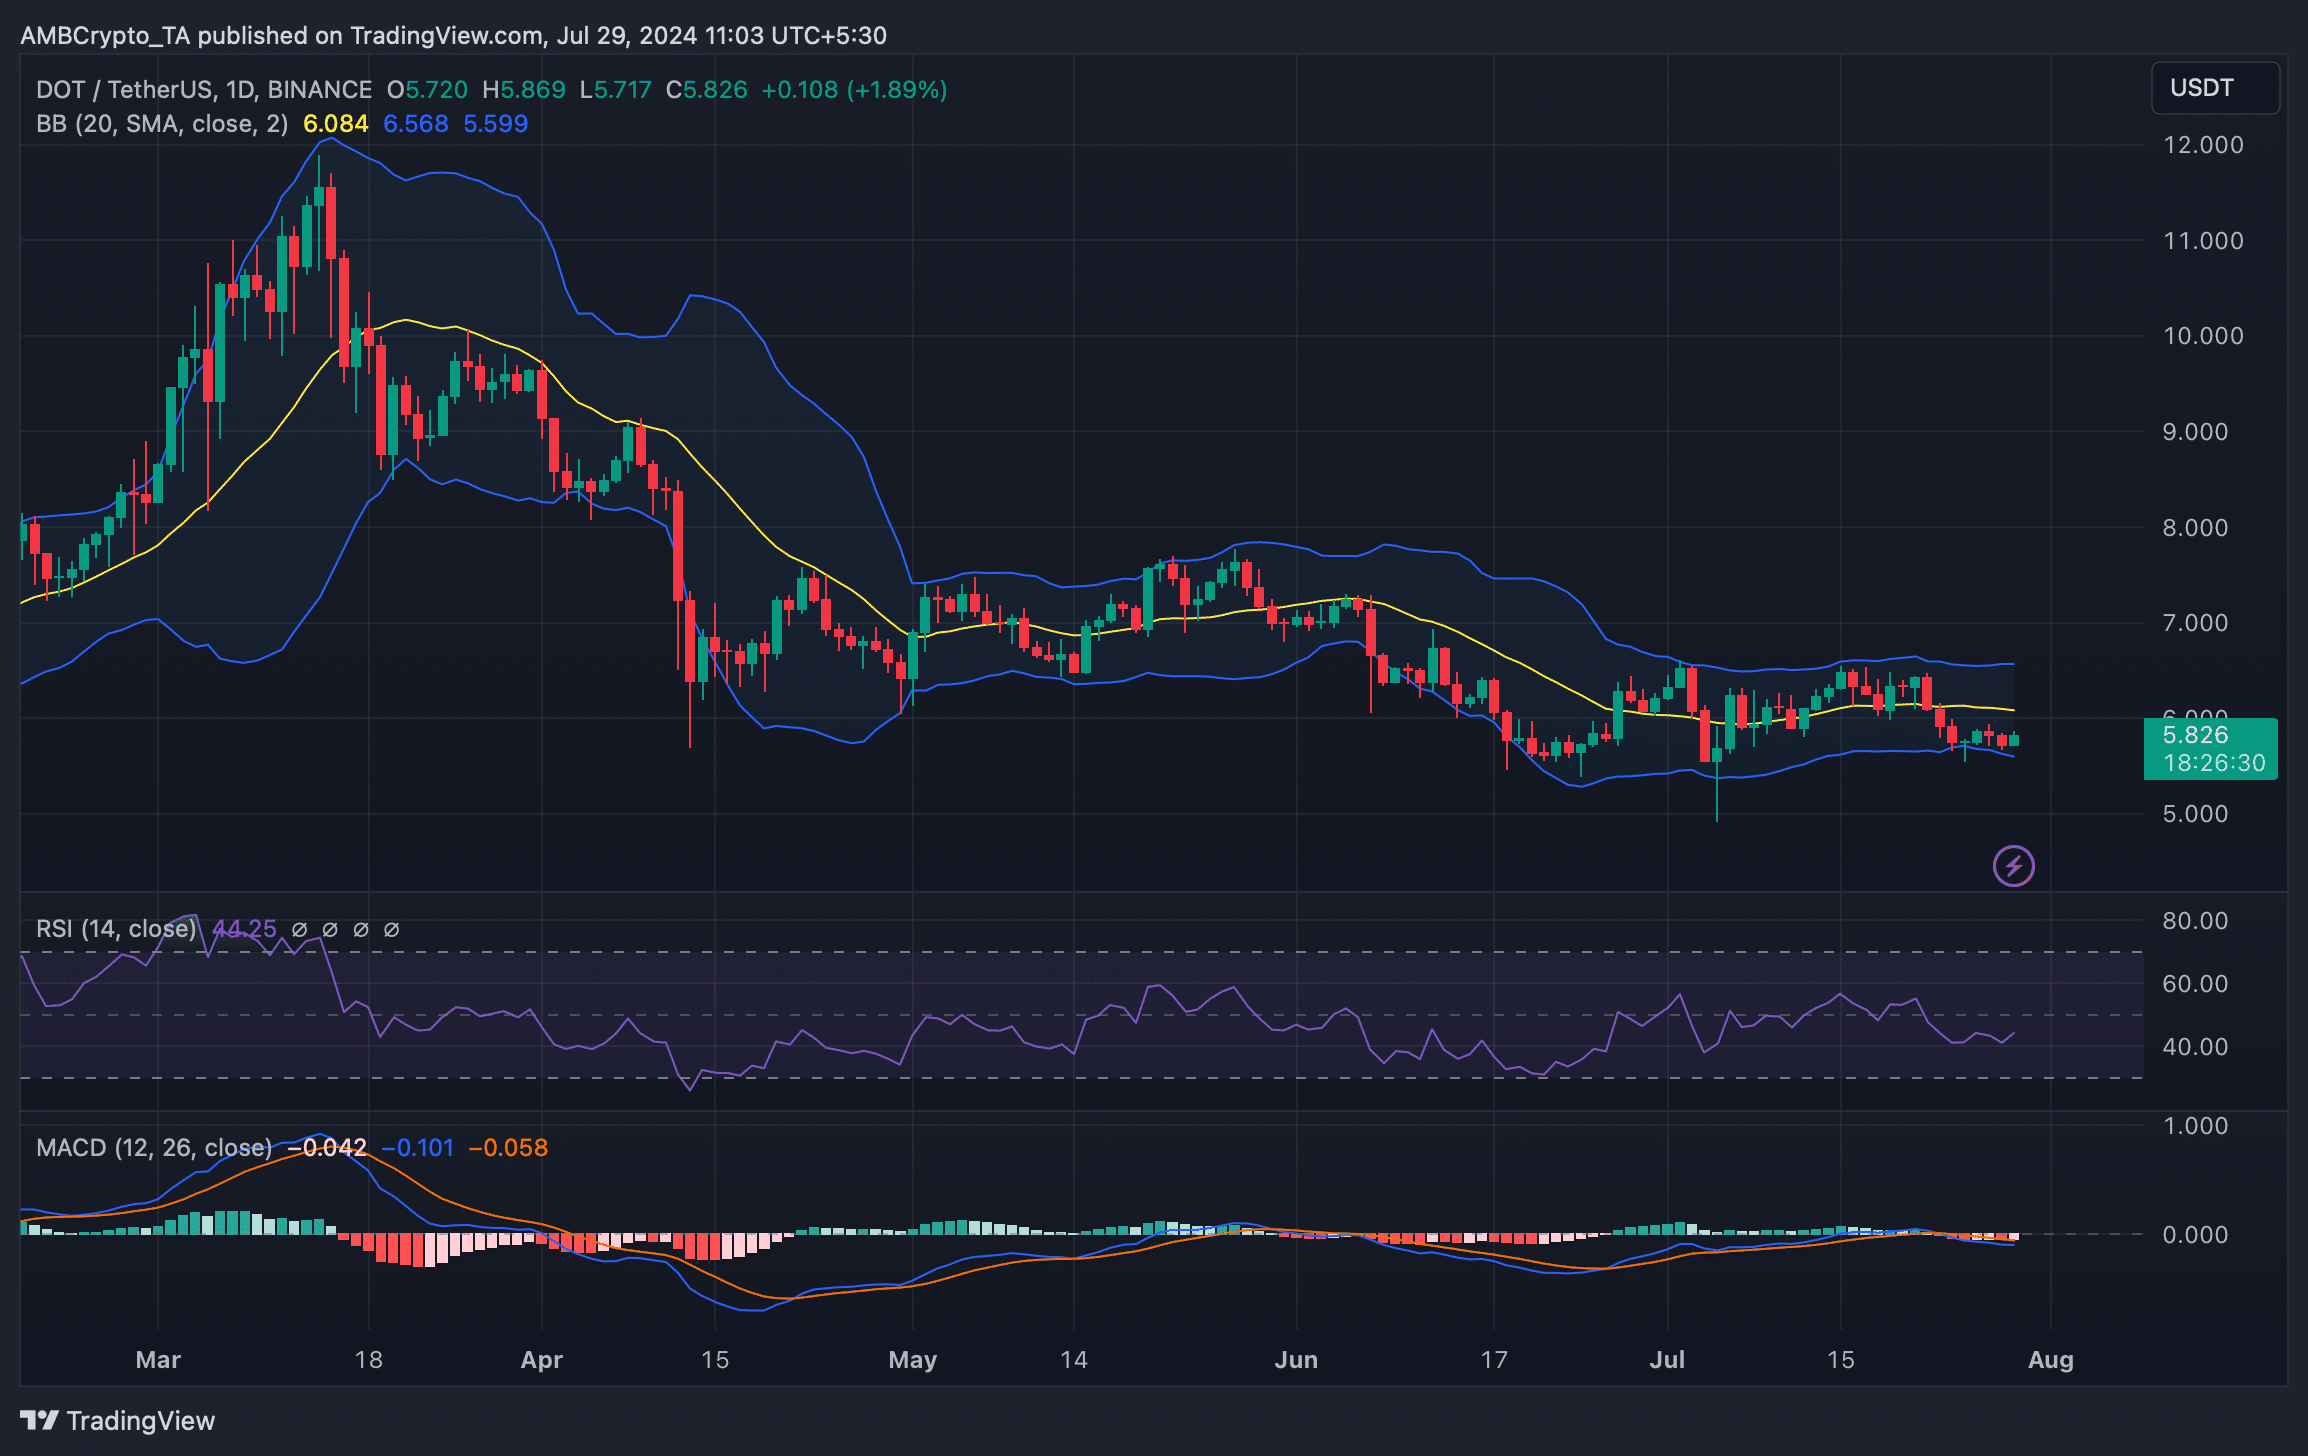
Source: TradingView
Read Polkadot [DOT] Price Prediction 2024-2025
AMBCrypto’s look at Hyblock Capital’s data revealed that if the bulls manage to take over the market, then investors might witness the token touch $6 in the days to follow.
But if the bearish trend continues, then DOT might drop to the $5.6-$5.5 range.
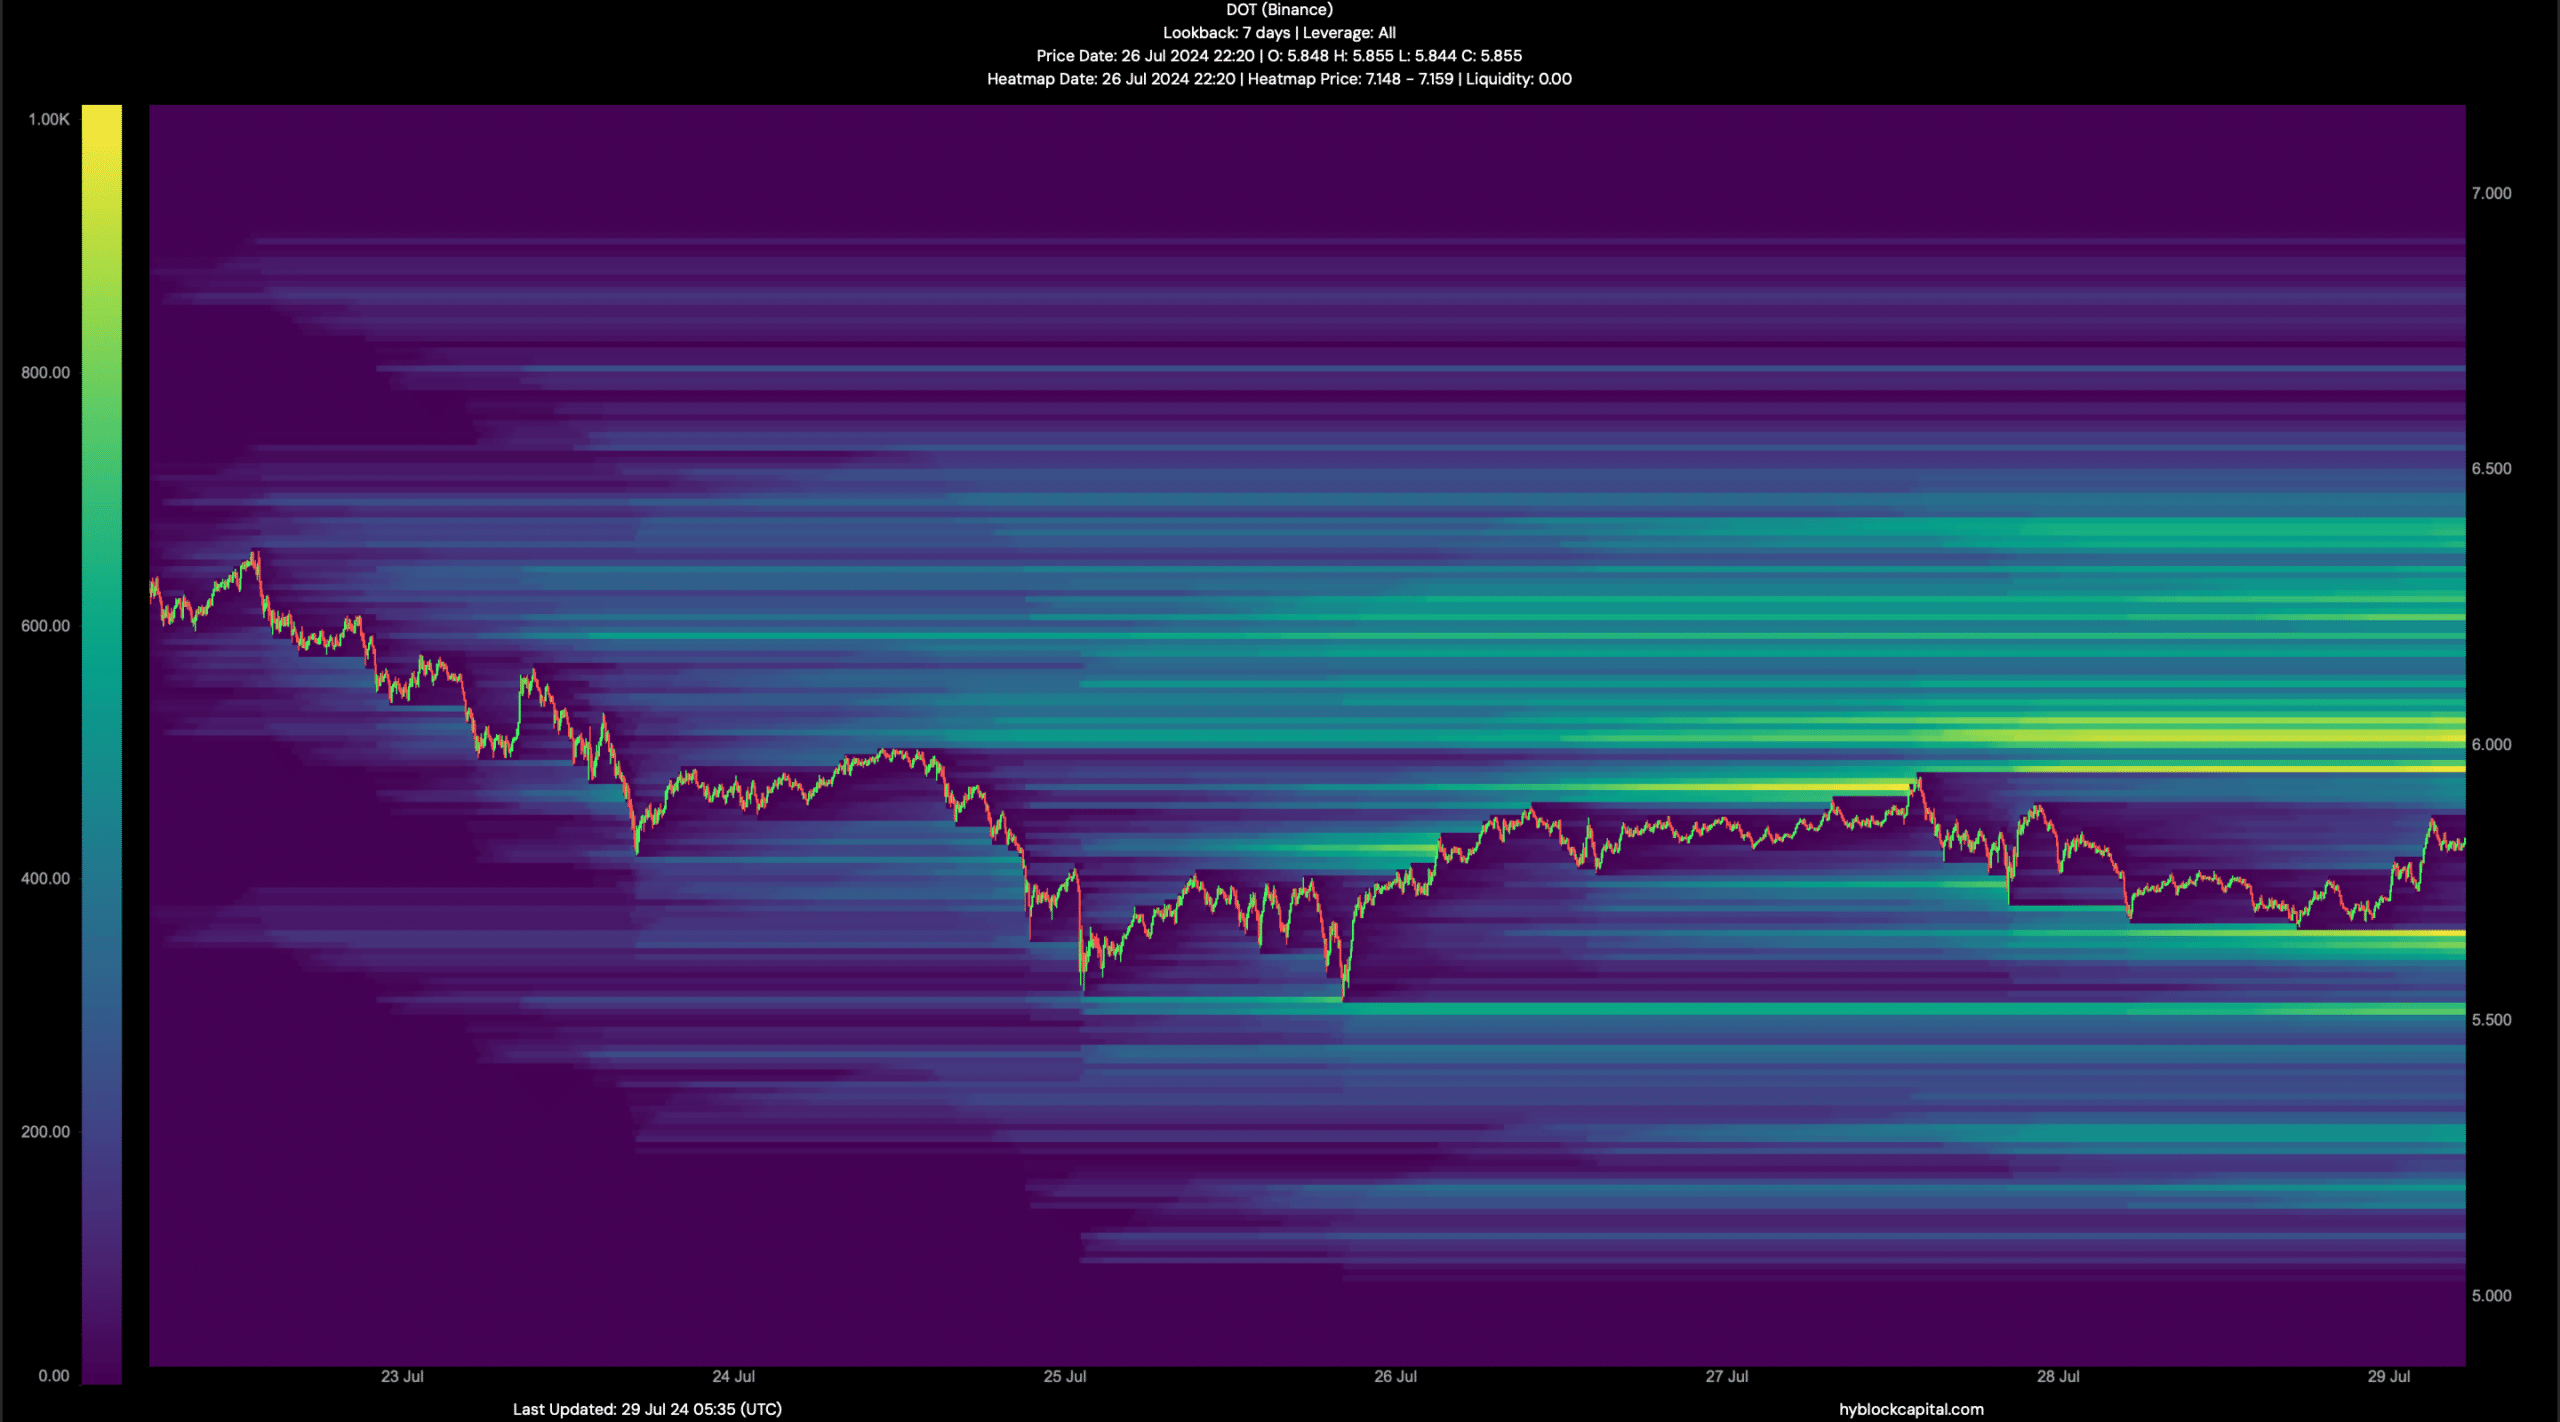
Source: Hyblock Capital