- Dogecoin did not see a volume or momentum shift to signal a price reversal yet.
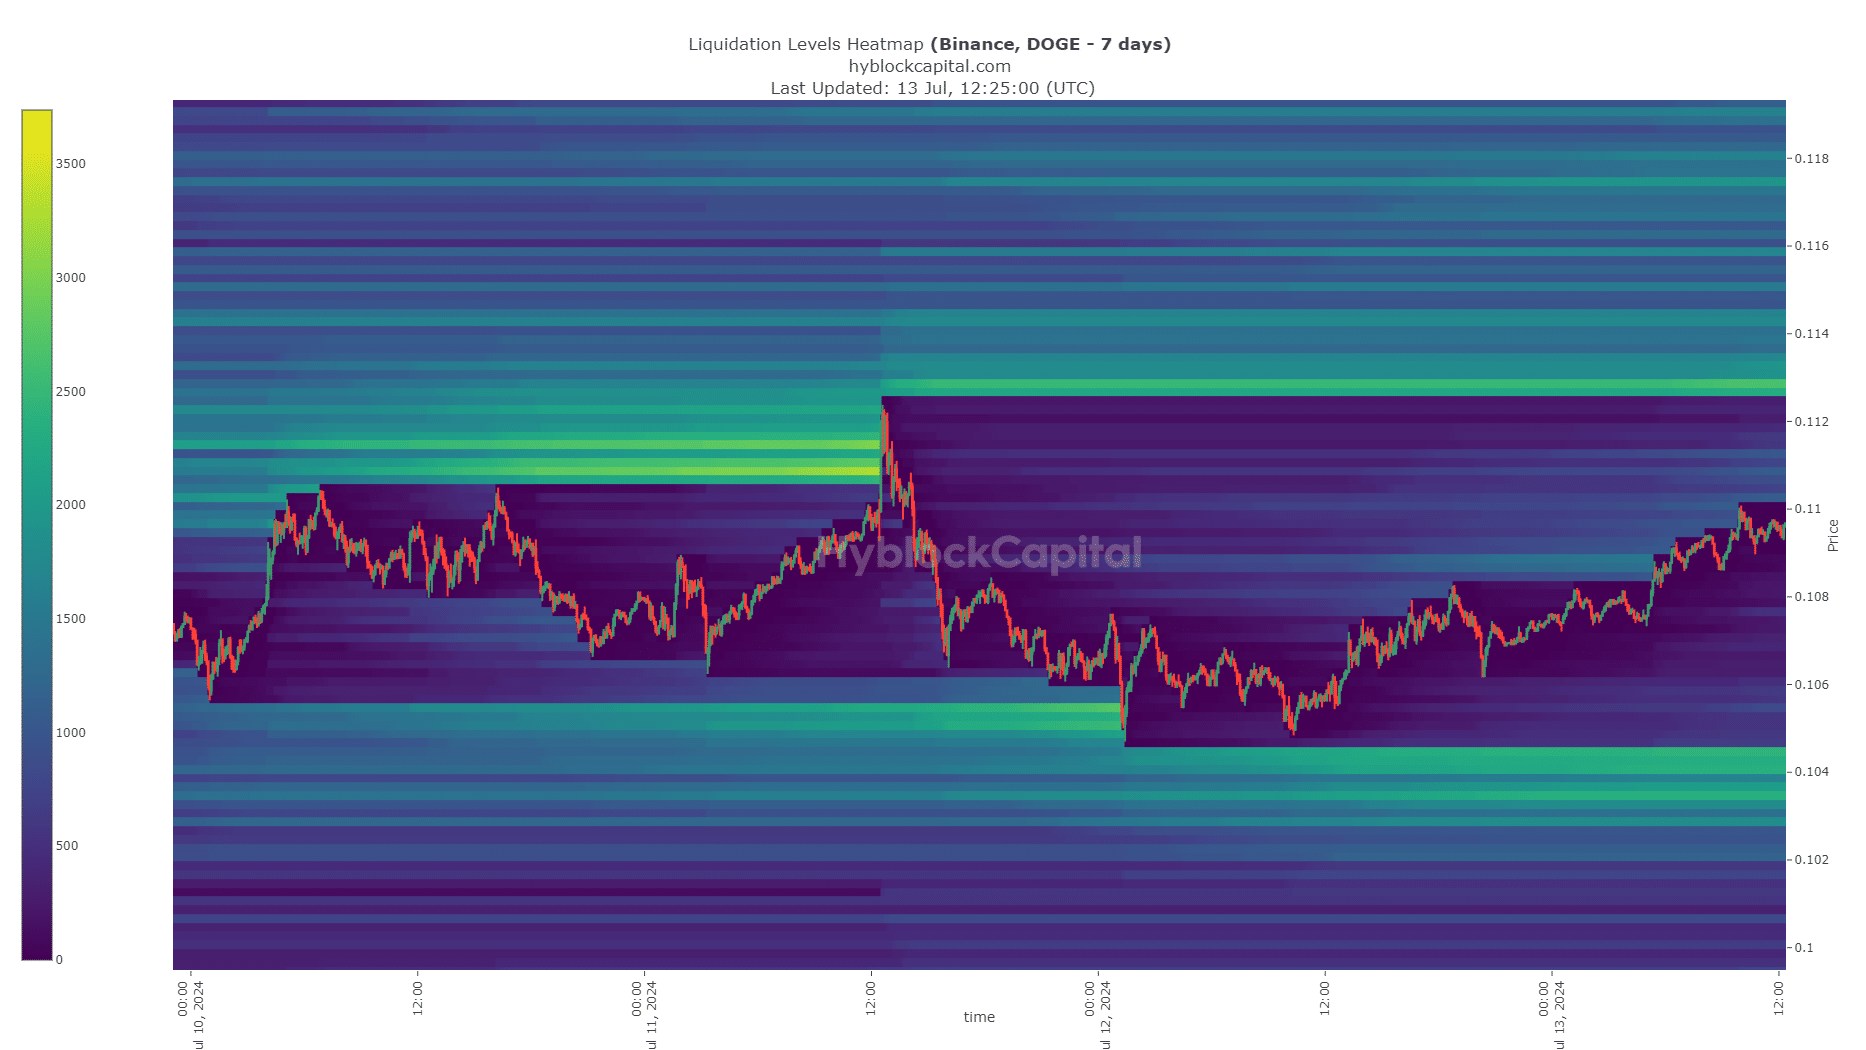
- The liquidation chart indicated a short-term range formation was possible.
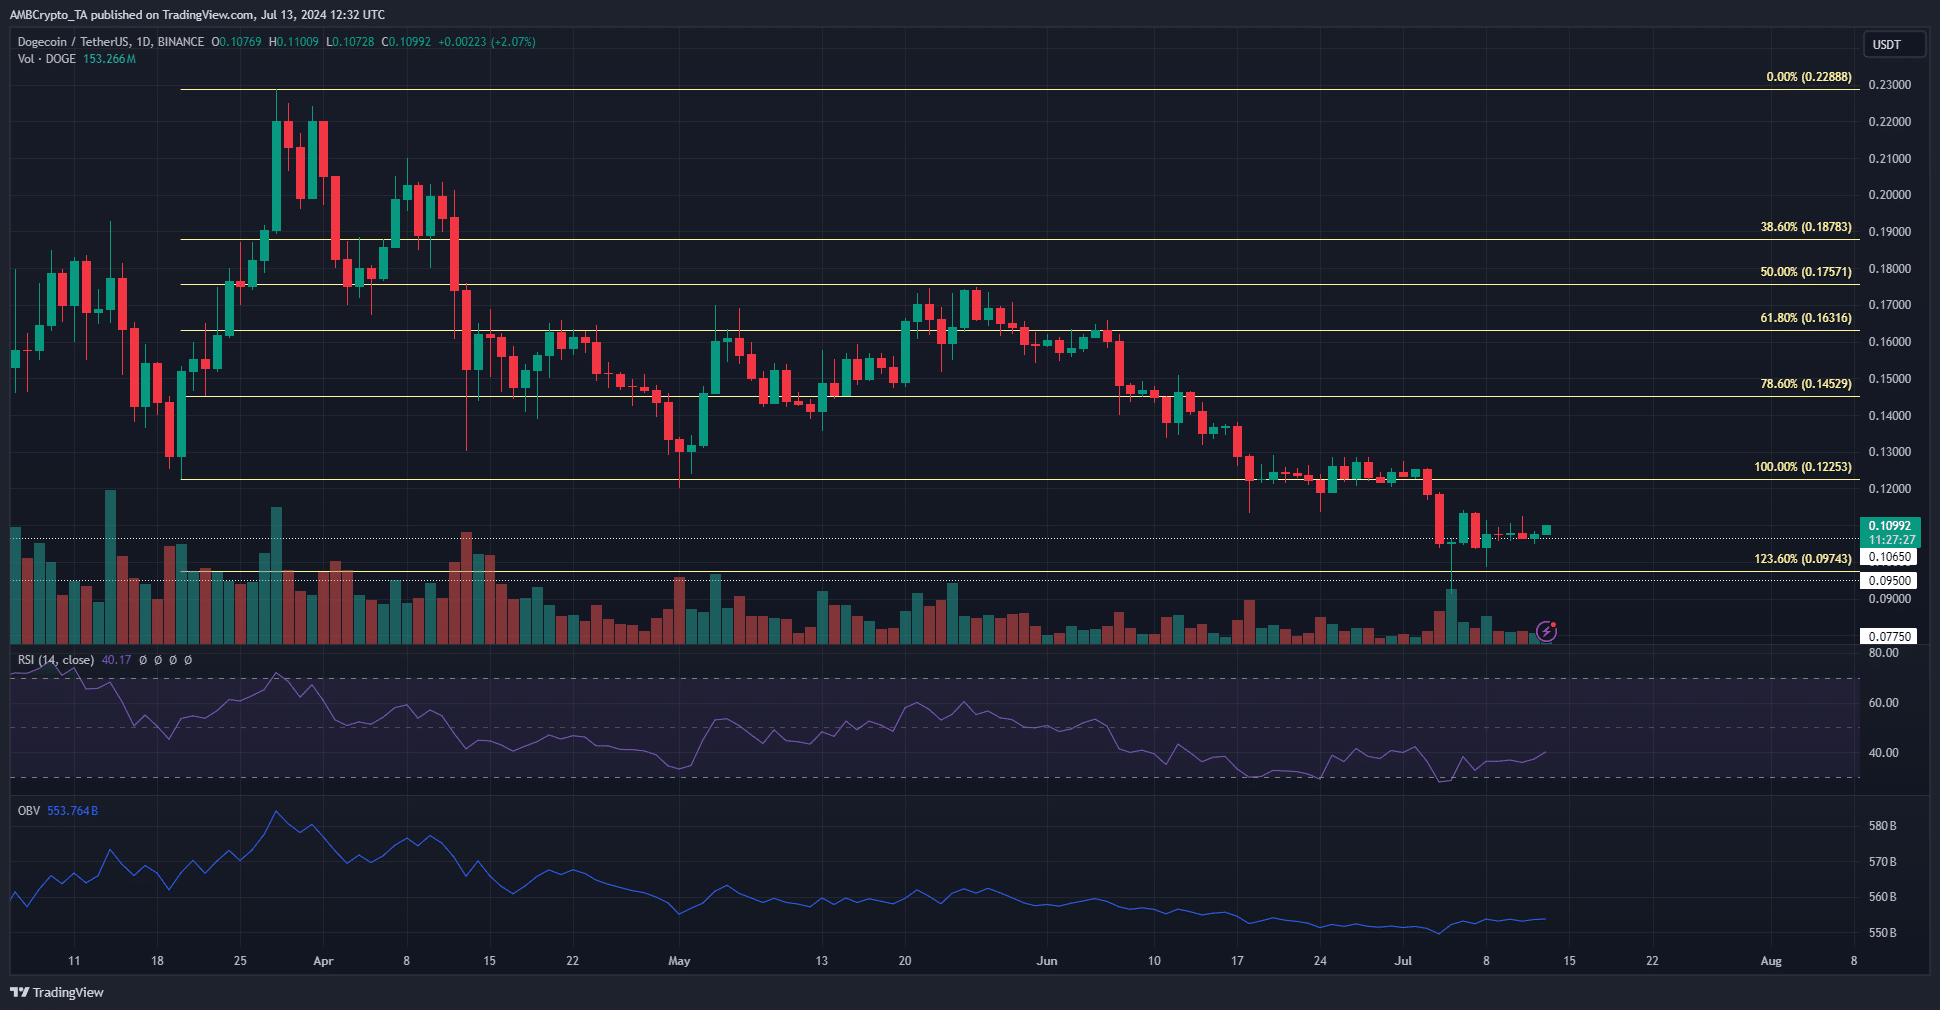
Dogecoin [DOGE] fell below the $0.123-$0.128 support zone that the bulls have defended since March. The bearish price structure on the daily chart was compounded by a lukewarm buying pressure, which indicated that the demand was not good enough for a quick reversal.

Source: DOGE/USDT on TradingView
The daily RSI was still below neutral 50 and the OBV has not stirred noticeably after the recent fall. Together they indicated bearish momentum was still dominant and the bulls were, thus far, powerless to change the trend.
Open Interest falls to pre-rally lows
The massive price surge in late February and March saw DOGE gain 176% in just over a month. At the start of the rally, the Open Interest was at $480 million, and on the 13th of July, it was at $478 million.
The substantial OI decrease in the past four months was a sign of the fading confidence among futures traders. If and when the meme coin breaks key resistance levels, the speculators might start to flood the market again.
With both the OBV and the Open Interest maintaining their slump, the conclusion is that buying pressure in spot and futures markets was at a multi-month low. The on-chain metrics did not indicate this might change anytime soon.
Dogecoin network metrics reflect token distribution
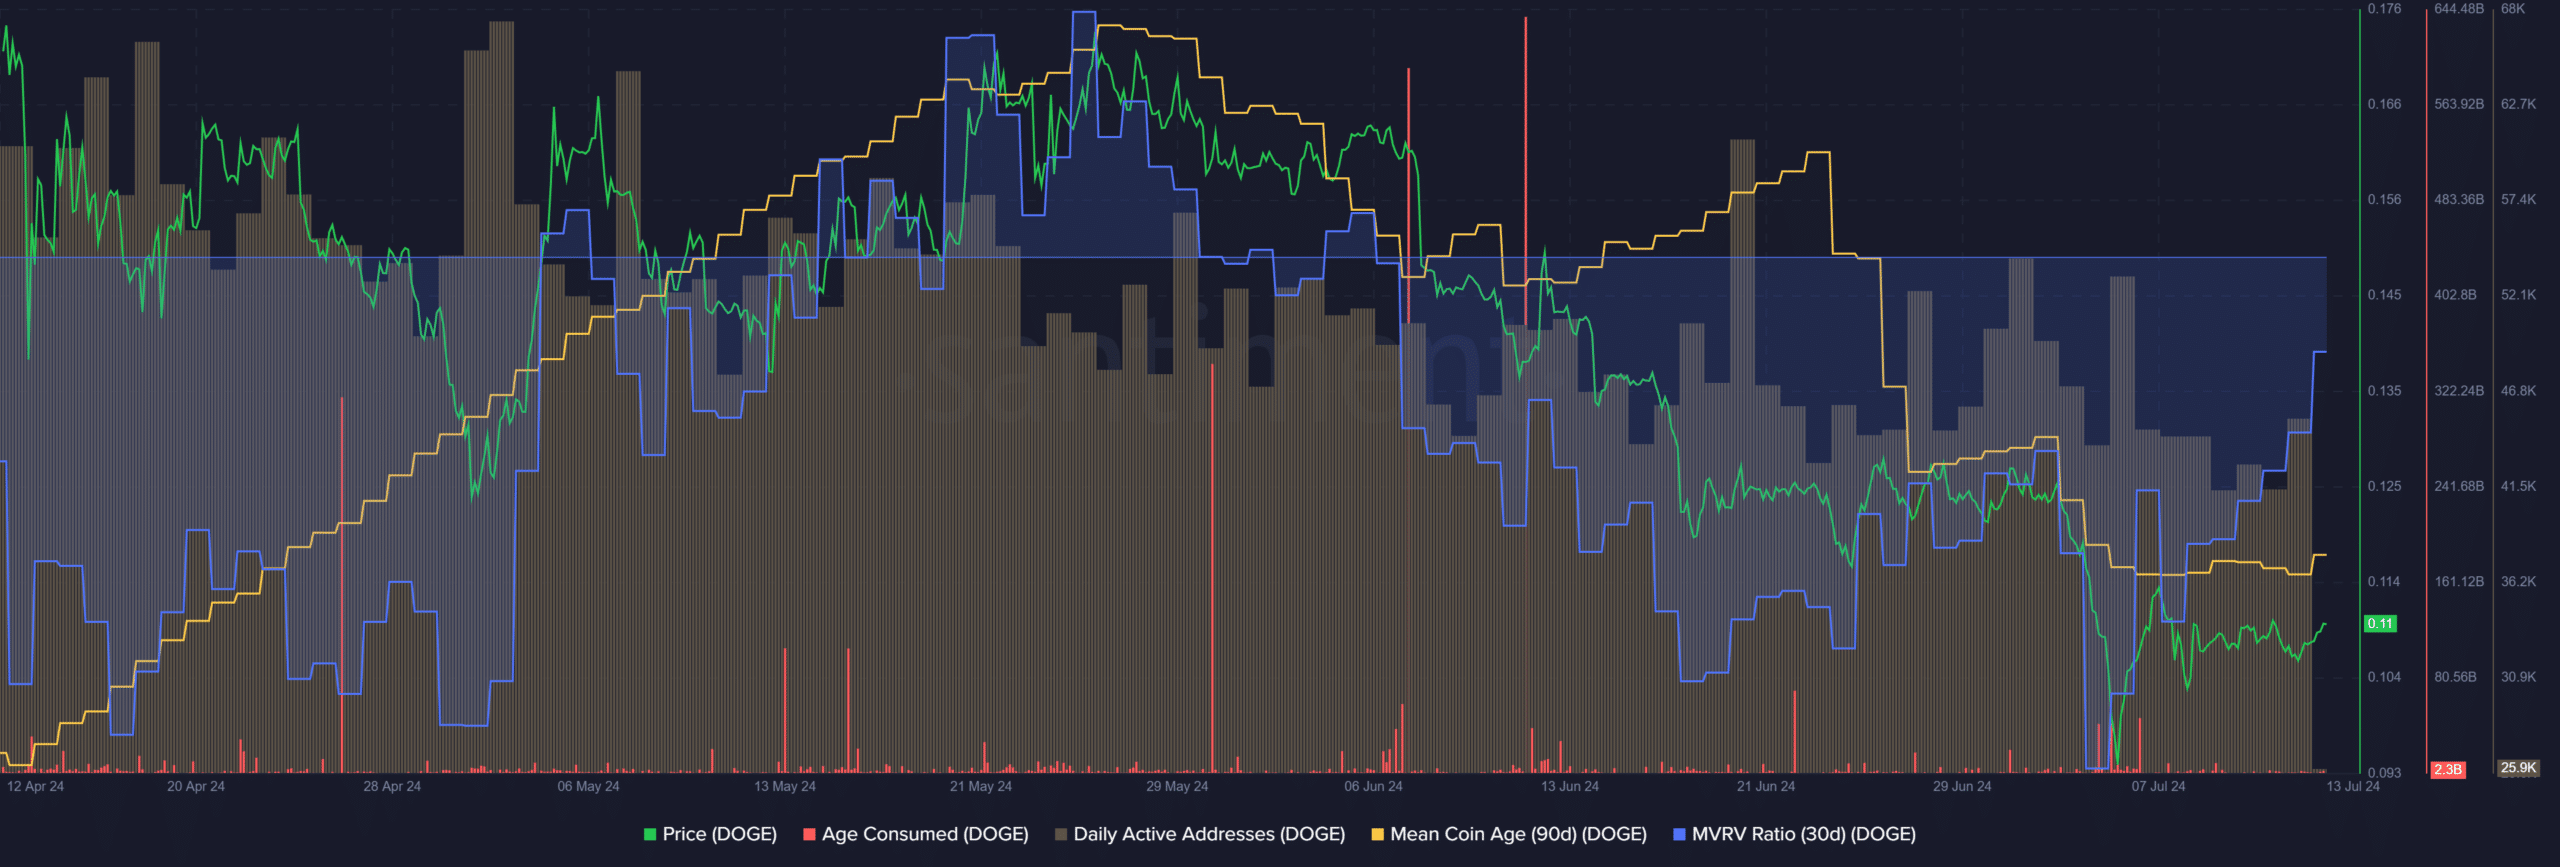
The 30-day MVRV ratio had been negative for the past month, showing short-term holders were sat a loss. At the same time, the mean coin age has also trended downward since late May, although it rose for ten days in June.
This meant that it was not a good idea to buy DOGE despite the meme coin being undervalued, since the falling mean coin age was a sign of distribution rather than accumulation. The age-consumed metric has been quiet since the past week’s price drop.
Read Dogecoin’s [DOGE] Price Prediction 2024-25
AMBCrypto found that the 7-day look-back period liquidation heatmap highlighted a potential short-term range formation between $0.104 and $0.1128.
Beyond $0.113, the $0.13 and $0.135 levels are the next resistances to watch.


Leave a Reply