

- LINK whale activity surged in the past week to 32.76M.
- Despite higher holder inflows, market sentiment remained bearish.
In the last two months, the crypto market has experienced extreme selling pressure. After Bitcoin’s [BTC] price declined to a two-month low, most altcoins were hit hard.
Chainlink [LINK], like other altcoins, did not escape the price drop, as it declined by 18.61% in the last 30 days. However, over the past week, a pattern reversal has been witnessed, with increased whale activity.
As of this writing, LINK has surged by 11.32 in the last seven days. These gains on weekly charts have left traders and analysts speculating about the main cause.
What’s driving gains?
According to various crypto analysts, increased whale activities have played a critical role in shaping current market sentiments. Renowned crypto analyst Ali shared on X (formerly Twitter) that,
“Chainlink whales have snapped up over 6.2 million $LINK this past week, totaling approximately $76.88 million.”
According to the analysts, whale activities are changing the market trend with increasing buying pressure, possibly pushing prices up.
According to AMBCrypto’s analysis of IntoTheBlock, large holders’ inflow has recorded a high of 32.76M in the last seven days.
The increased whale buying spree has pushed market sentiment, with LINK likely experiencing a seasonal bottom. With its prices at the bottom, whales were buying at press time, speculating an upward trend.
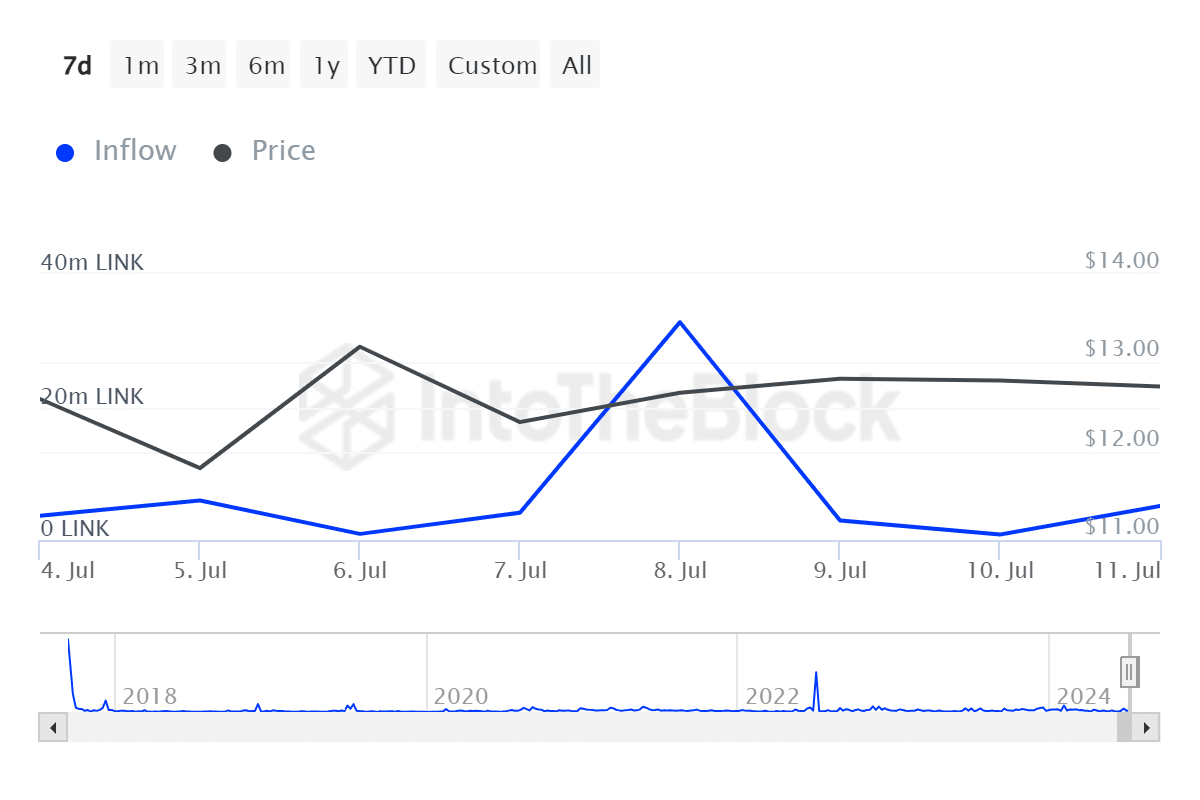
Source: IntoTheBlock
Such opinion was shared by Michael Van De Poppe on X, who noted,
“$LINK has been getting a seasonal pattern of finding bottoms in June of every year. Very likely, it’s having the same bottoming procedure in 2024 and will start to crawl upwards from here.”
Based on this, buyers enjoyed low prices, which always tended to drive the demand for the altcoin. Usually, a higher demand for the altcoin pushed the prices up because of the buying pressure.
What LINK price charts suggest
AMBCrypto’s analysis indicated that LINK was experiencing a sustained bearish trend at press time, despite the recent whale buying spree.
LINK’s Directional Movement Index (DMI) indicated a strong bearish trend, with the positive index at 10.07 below the negative index 45. This showed that recent losses outpaced gains amid higher selling pressure.
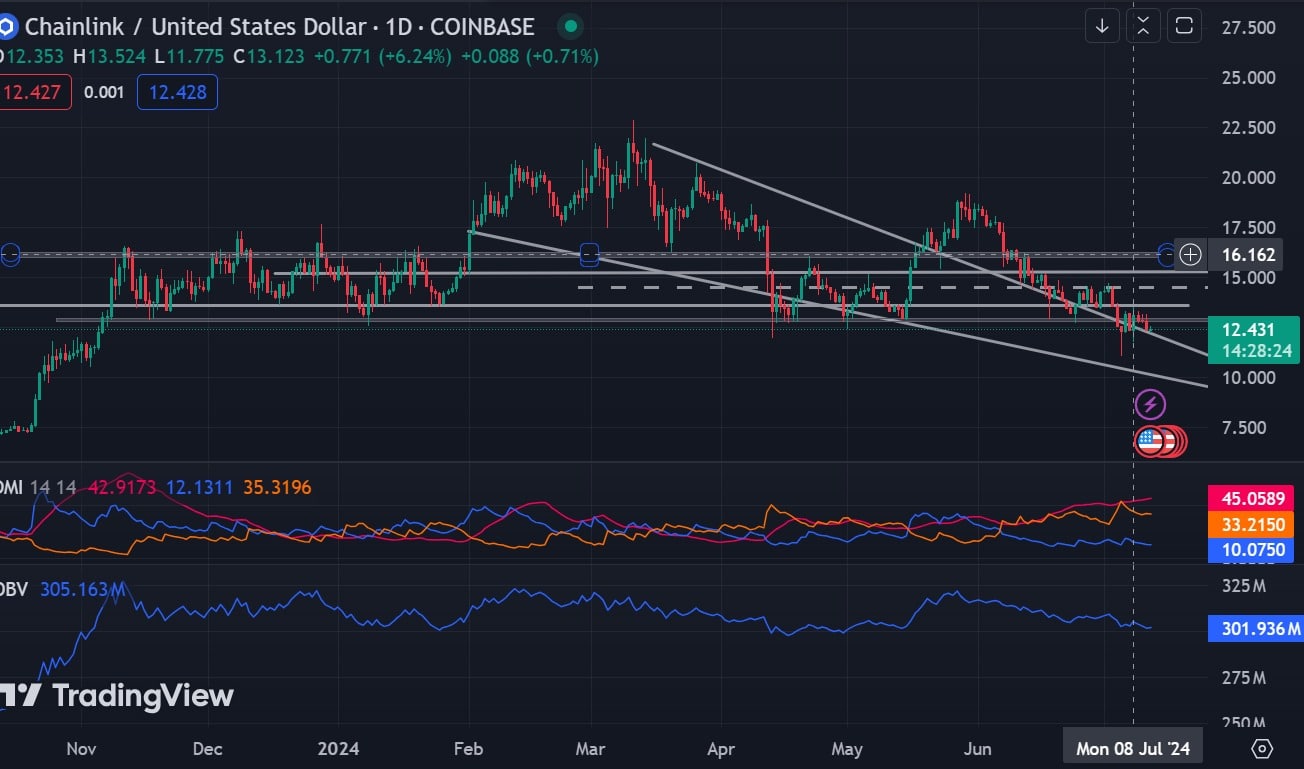
Source: TradingView
Equally, the On Balance Volume has declined from $311M to $301M in the last seven days. This suggested the volume on up days was not as strong as before, indicating lower buying pressure as selling pressure is dominant.
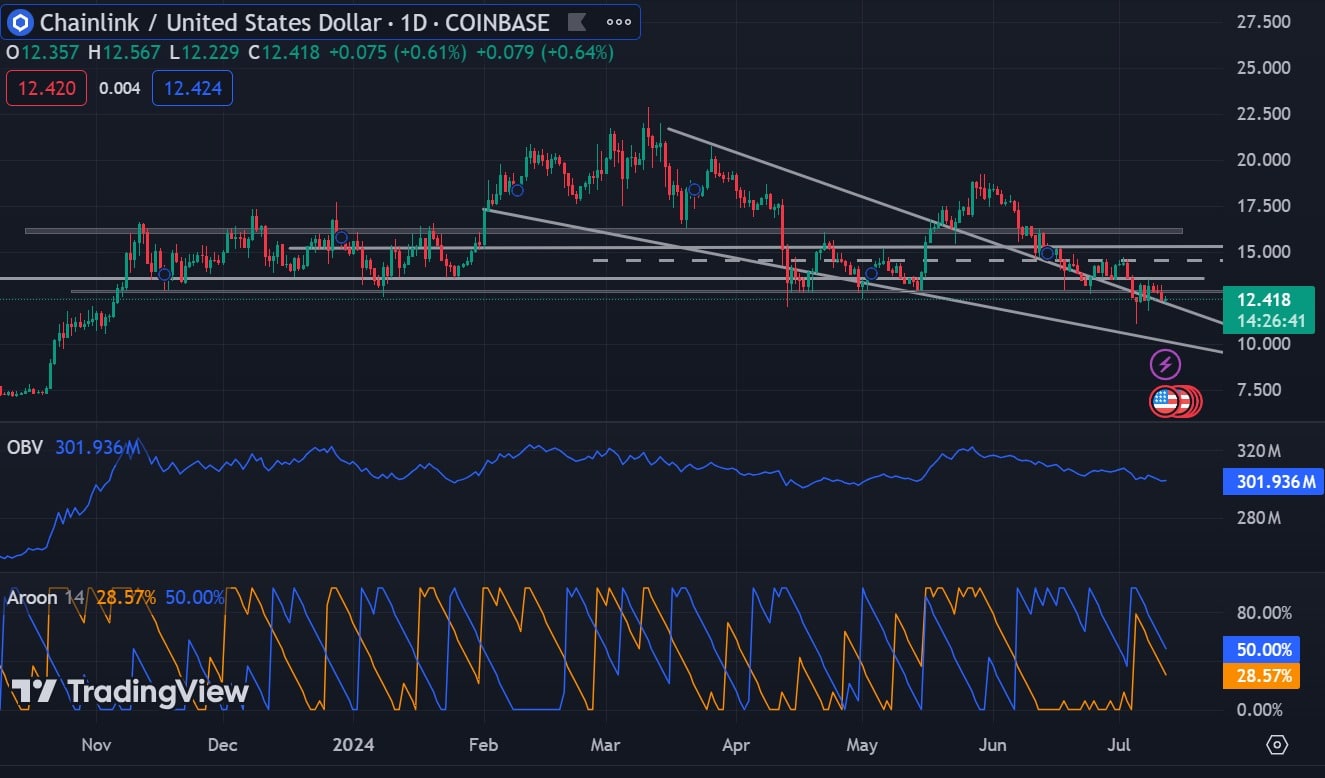
Source: TradingView
Also, the Aroon up line at 28.57% sat below Aroon down at 50%, further confirming a sustained bearish trend.
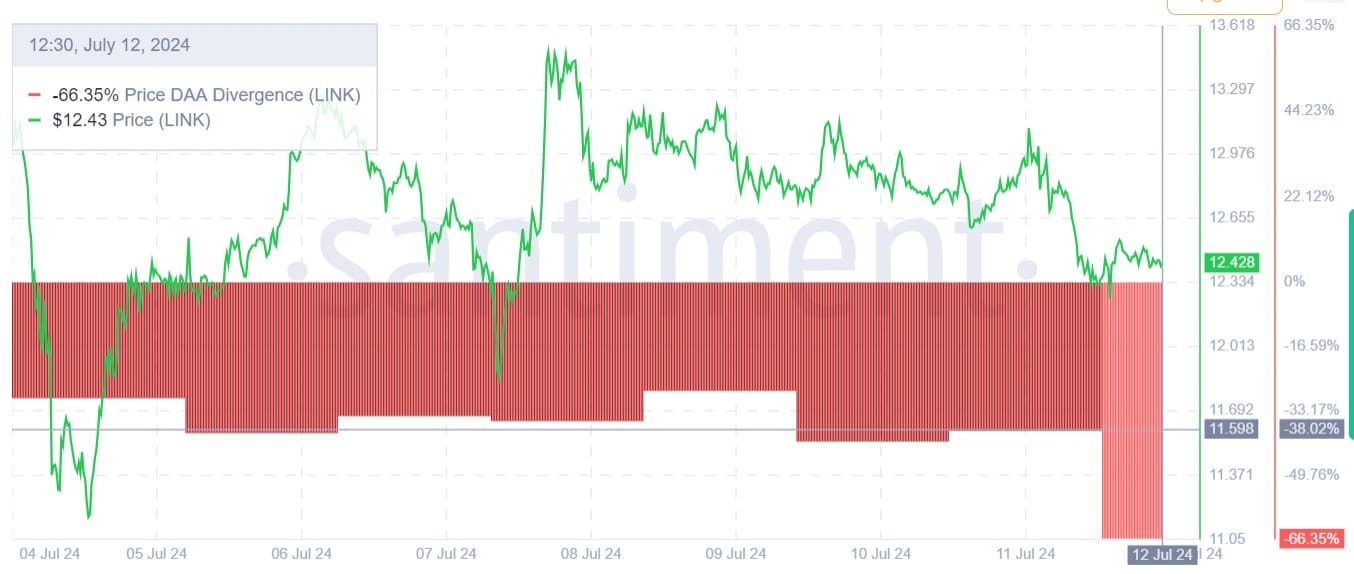
Source: Santiment
Finally, AMBCrypto’s analysis of Santiment’s data showed that the price DAA divergence was negative at -66.35%. This showed that the prices were making daily highs while DAA was making lows.
This showed that despite the recent price increase, daily addresses were reducing, which showed negative market sentiment.
Realistic or not, here’s LINK’s market cap in BTC’s terms
Can LINK whales drive prices up?
With the daily RSI at 39 — the lowest since May, LINK has experienced sustained selling pressure. However, if the whale inflow maintains, a trend reversal might occur.
As a result, prices could decline to $12.114 and $11.322, respectively. Consequently, if recent whale activities drive buying pressure and daily charts close above $12.625, the prices will rise to $13.585.