

- BNB’s price plummeted by 10.11%, with notable declines in on-chain activity
- Technical analysis revealed that BNB bulls defended the support ably
Barely a month after Binance Coin [BNB] hit its all-time high of$720.67, the price fell again. This decline included a 10.11% fall between 4 and 5 July.
While the coin’s price has been bearish since the month began, not many holders expected a steeper correction within such a short period. In fact, according to AMBCrypto’s own analysis, the value of the cryptocurrency tumbled due to large sell-offs in the market.
User activity low, kicks BNB demand down
However, there have been other reasons too. First off, there was a notable decline in on-chain activity. We found evidence of this decline after examining data from DappRadar.
DappRadar is the analytics platform that provides real-time insights of things happening on-chain. According to the platform, the total Unique Active Wallets (UAWs) on BNB Chain fell by 9.14% in the last seven days.
In crypto, UAWs measure user engagement and activity on a blockchain. If the metric rises, it means that there has been a hike in interaction and use of a coin.
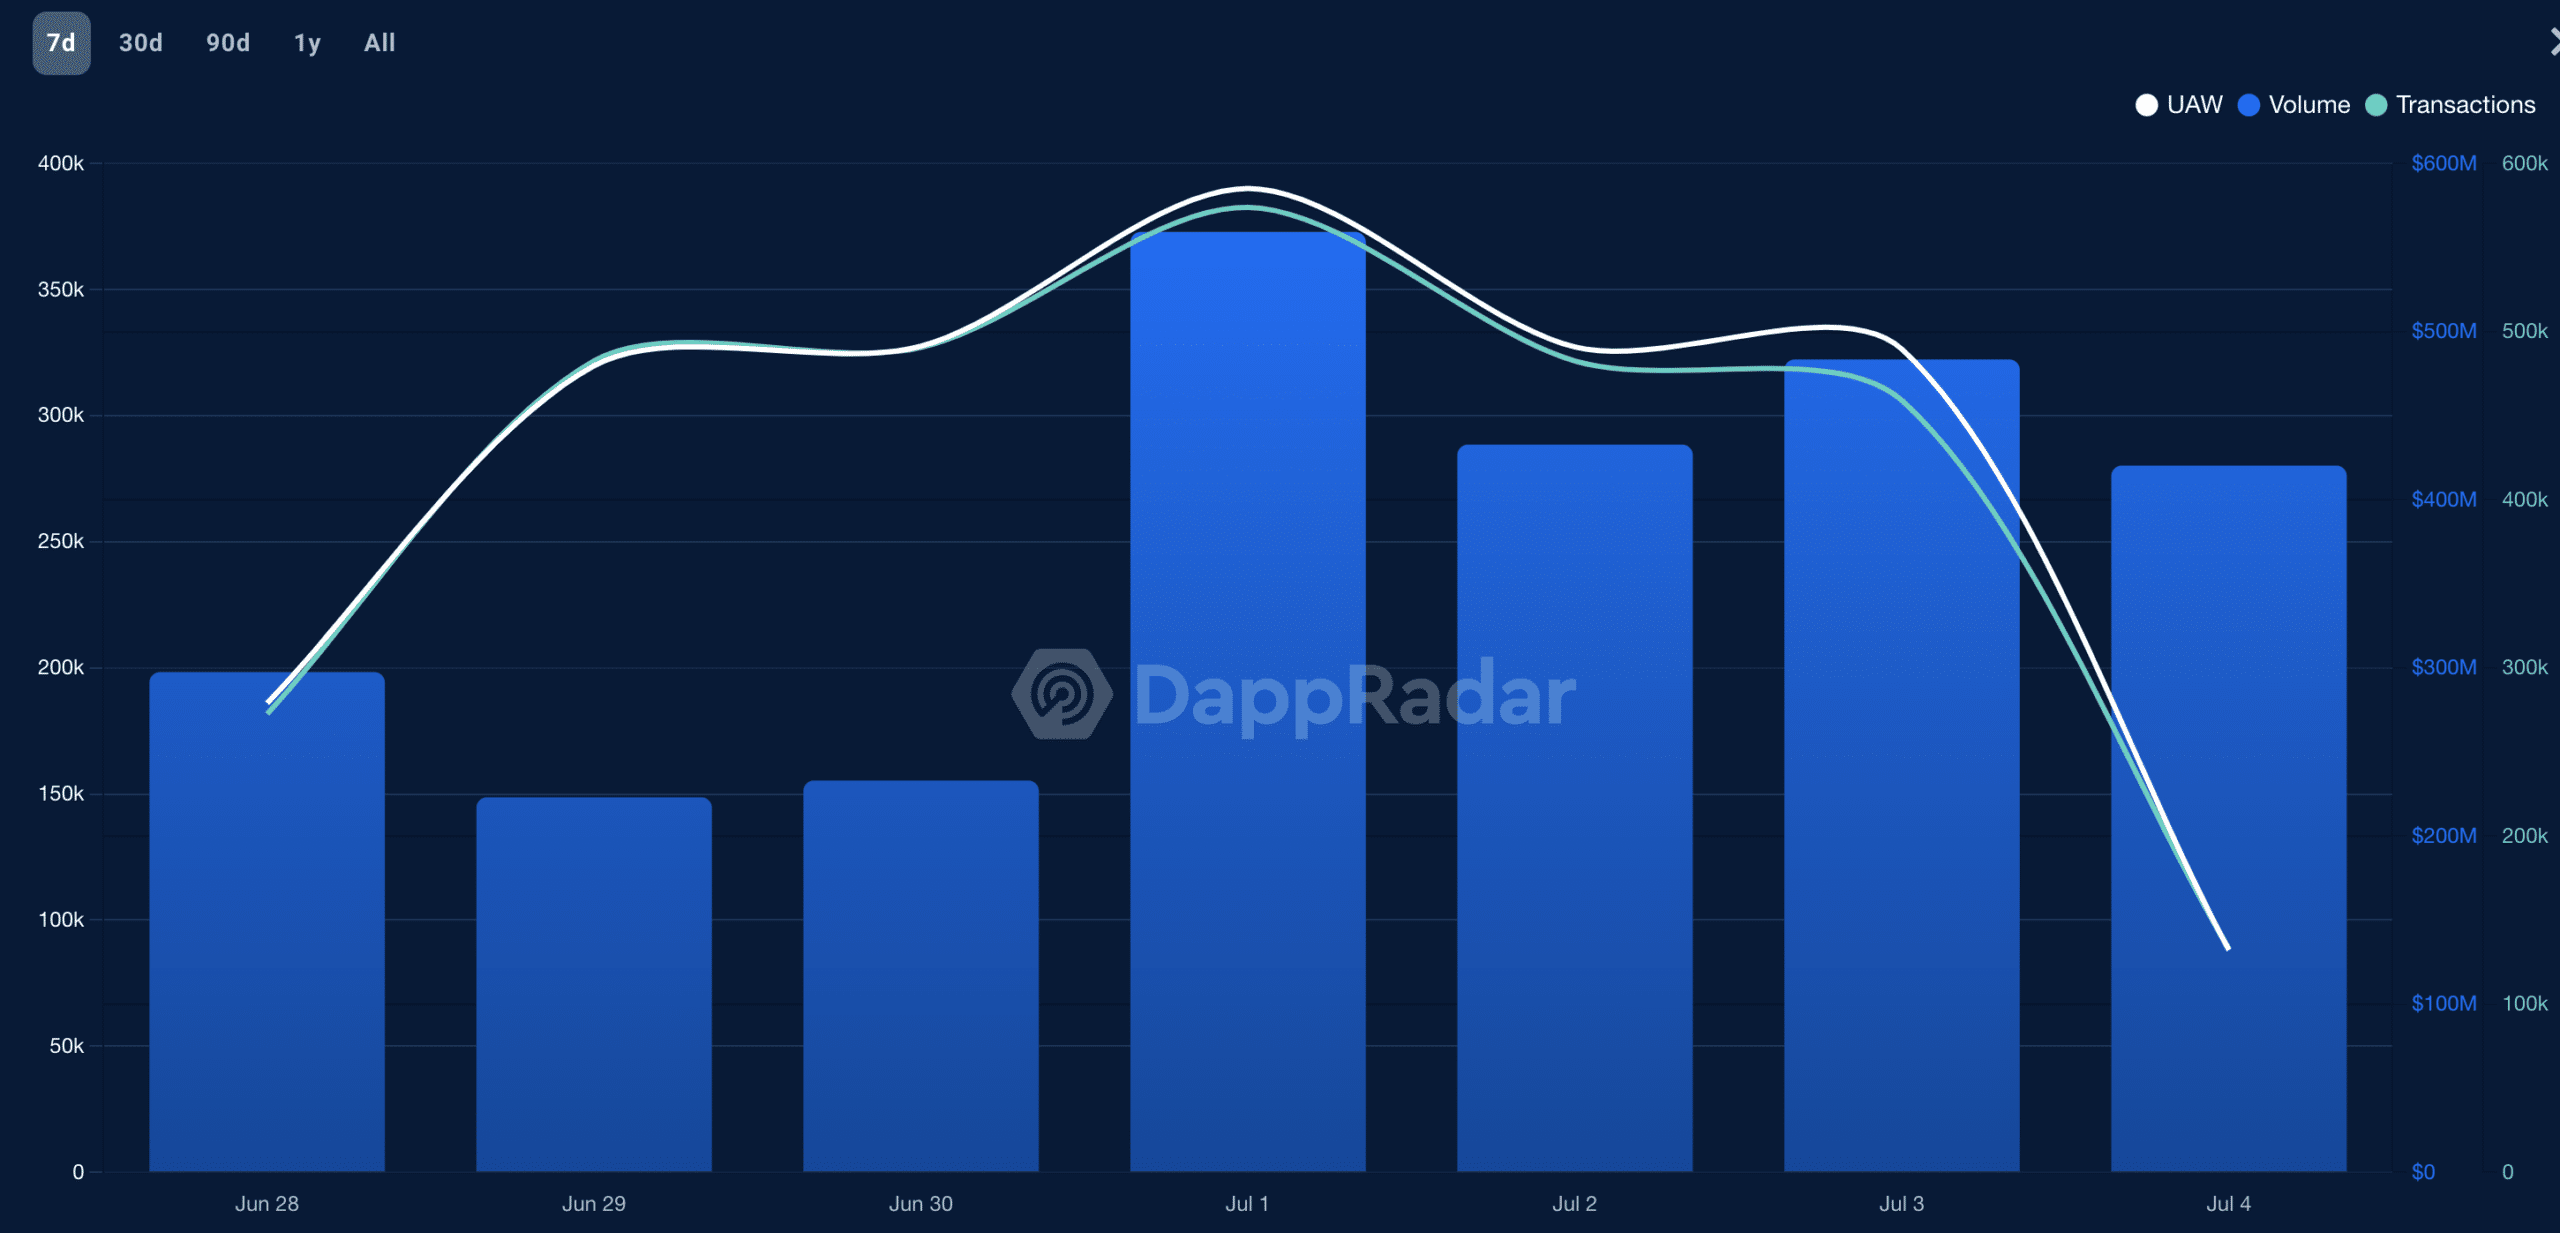
Source: DappRadar
However, when the metric falls, it implies that demand for cryptocurrencies within that ecosystem is low. If this persists, it either causes consolidation or prices decline like BNB has done in recent times.
Another factor affecting the coin’s decline is the Total Value Locked (TVL). The TVL, as the name implies, is the value of assets locked on a blockchain.
When the TVL climbs, it means that market participants are depositing more assets into protocol under the chain. However, at the time of writing, the value which was over $5 billion 30 days ago, was below the threshold.
Apart from the interaction with BNB (the coin), this decline also suggested that activities like token exchange and staking were nowhere close to their previous peaks.
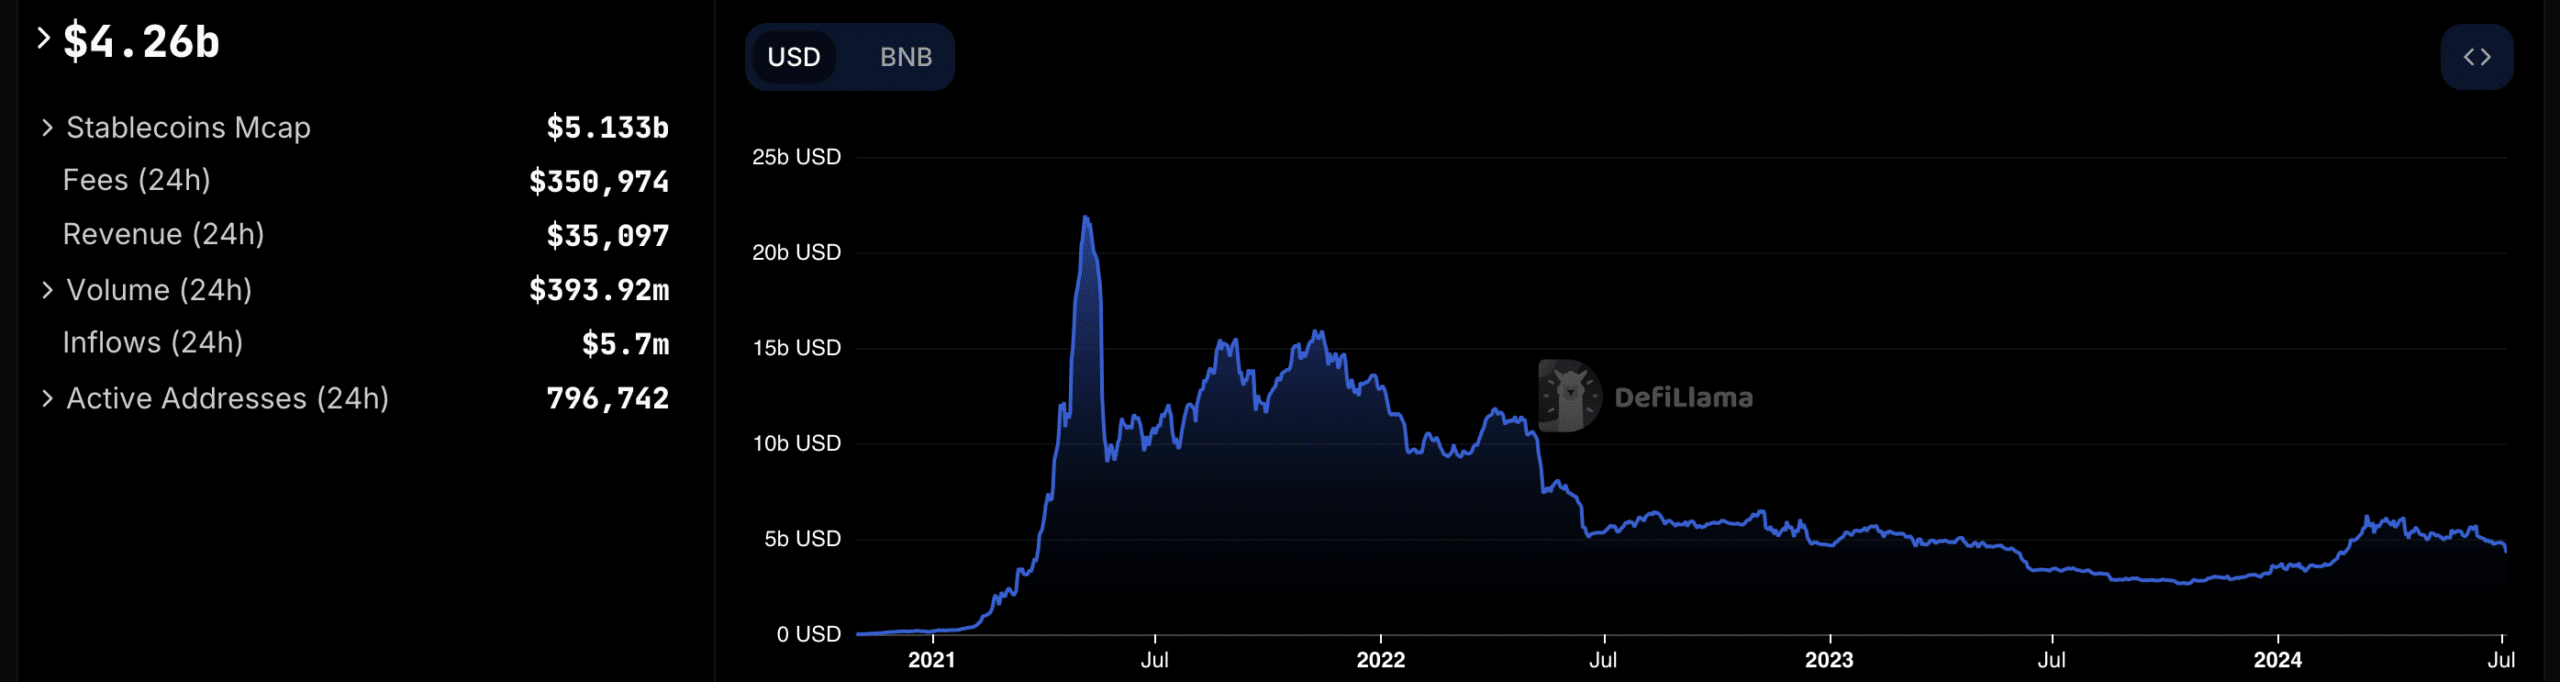
Source: DeFiLlama
Altcoin eyes a return to $526
Should this continue, the price of BNB could go lower. According to the 4-hour chart, BNB bulls seemed to have defended the support at $469.60. As a result, the price bounced off the lows.
Trading at $479.90 at press time, the altcoin was within reach of retesting $500. Here, it’s worth noting that the the Relative Strength Index (RSI) had previously reached the oversold level when the reading dropped below 30.00.
However, at press time, the RSI was rising, indicating that the momentum was leaving the bearish zone. If sustained, BNB’s price might be able to revisit and stay above $500.
It was also the same situation with the Money Flow Index (MFI), which was starting to show signs of re-accumulation. Once $500 is breached, there is chance that BNB would attempt to hit $526.90.
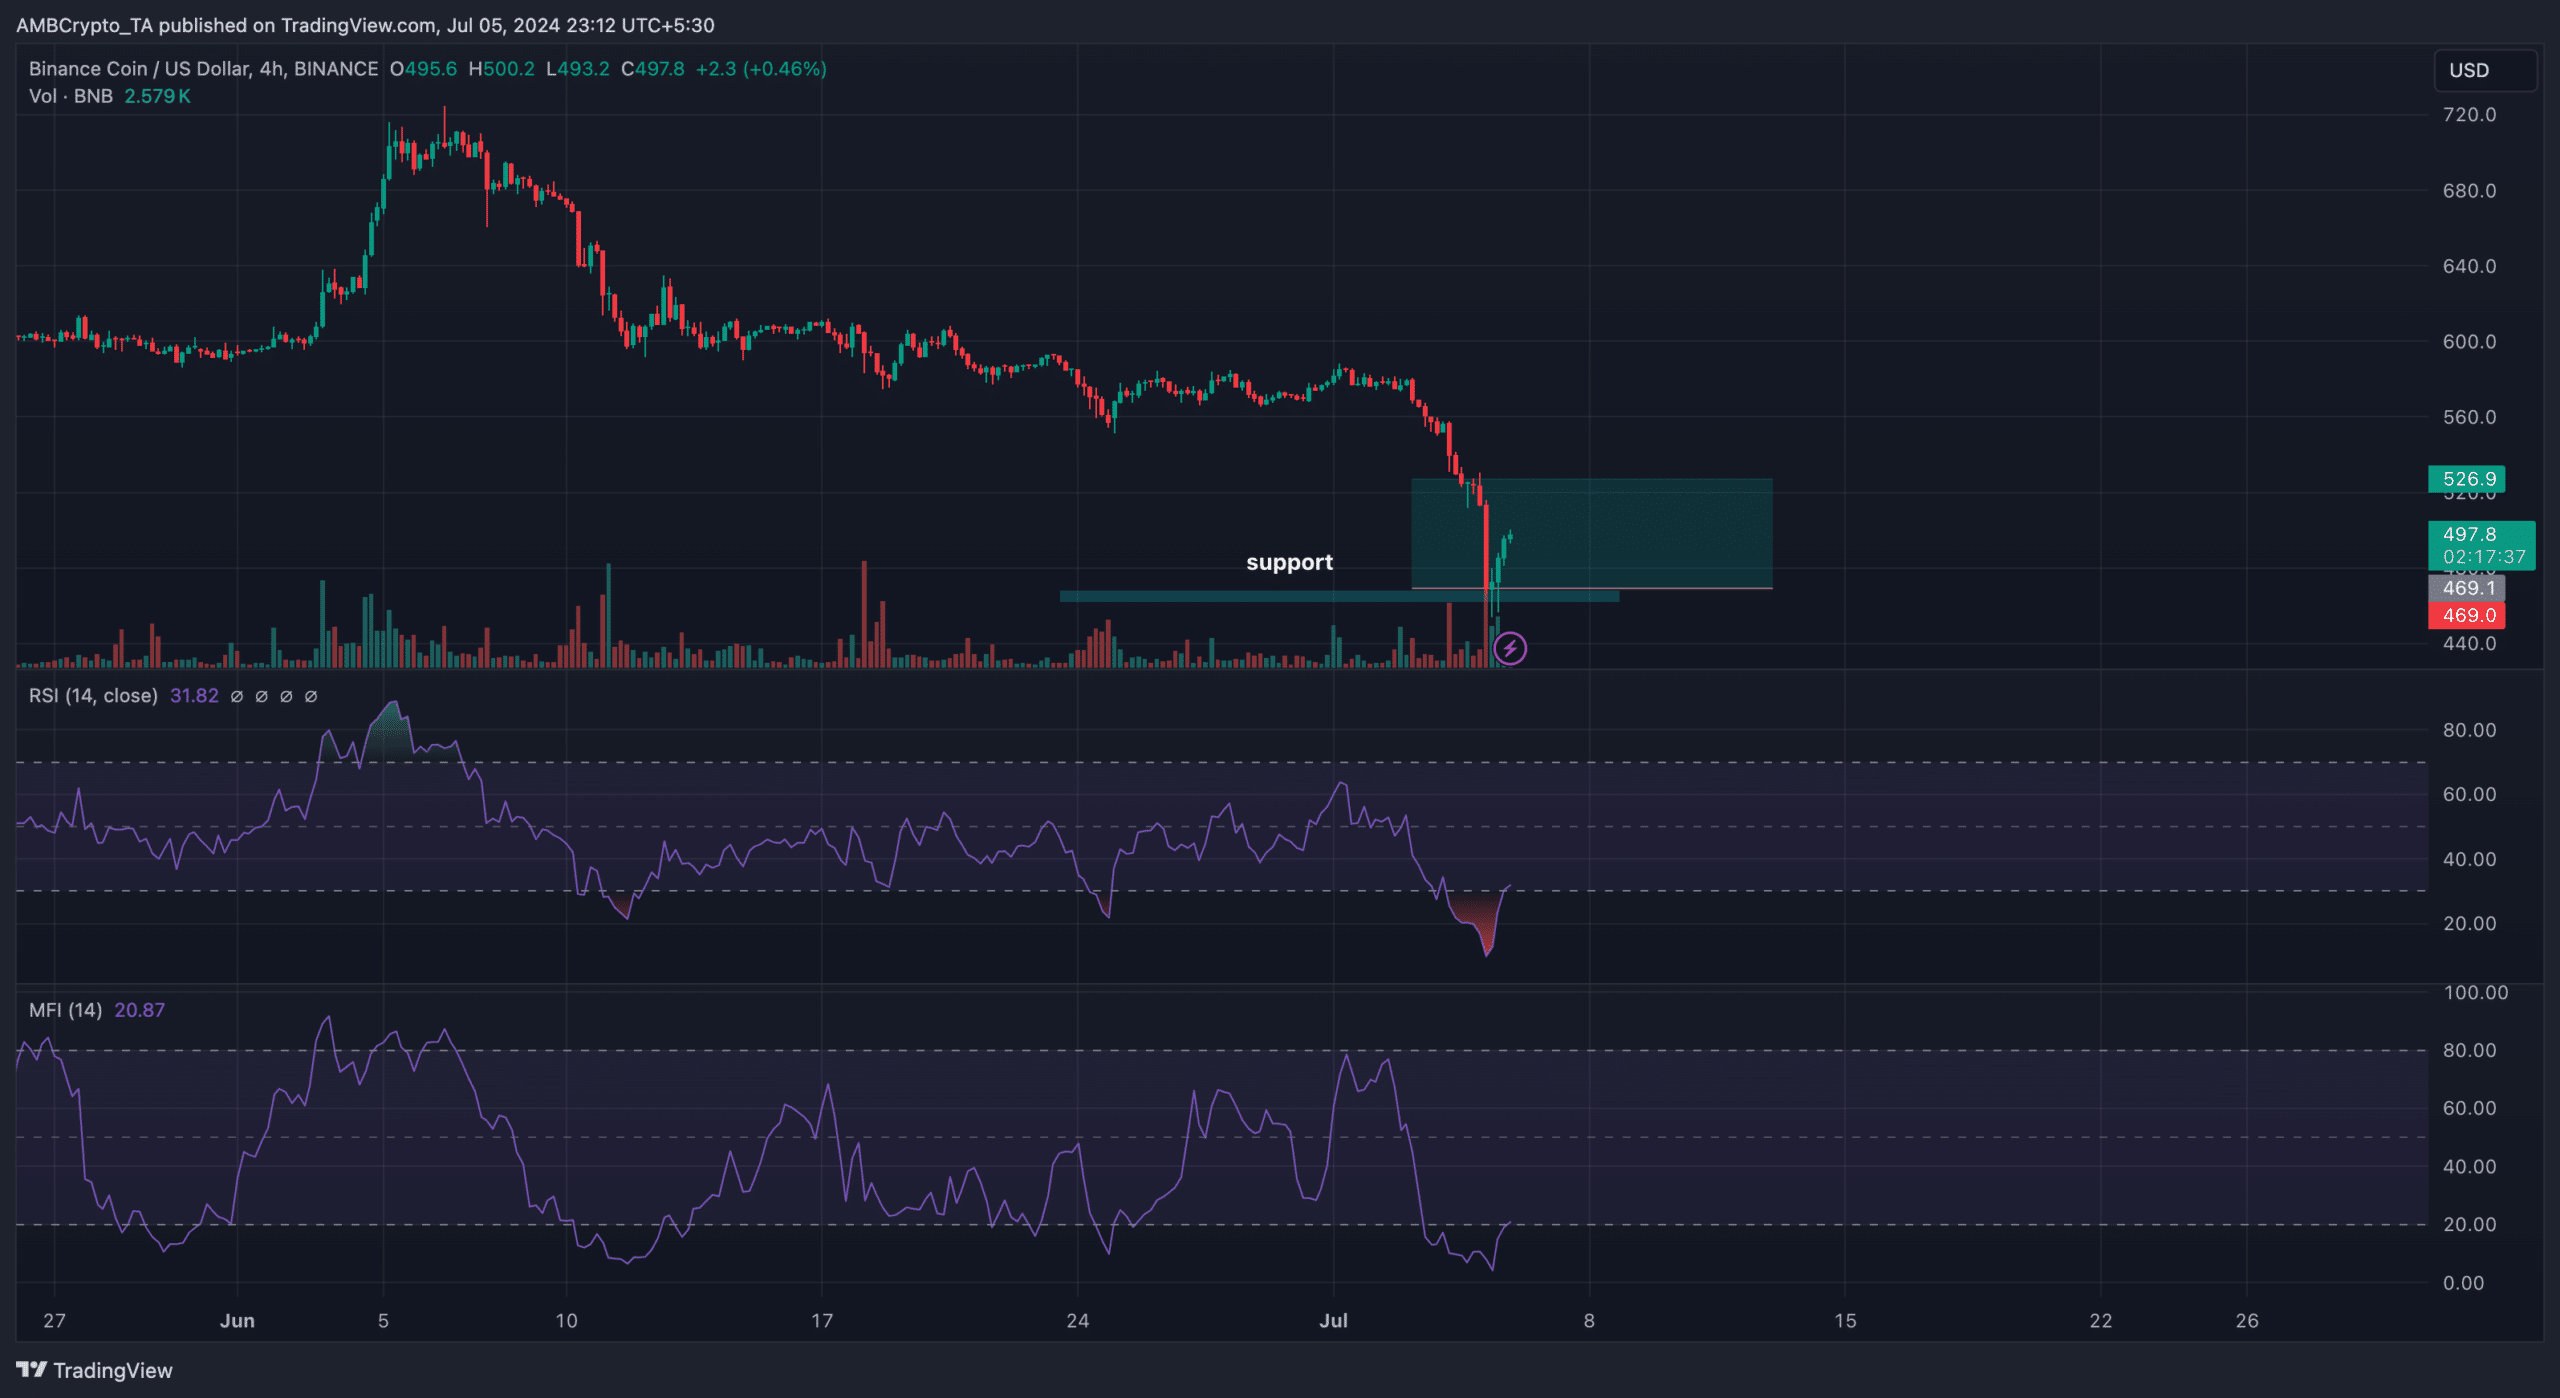
Source: TradingView
Realistic or not, here’s BNB’s market cap in BTC terms
Despite the bullish potential, however, the value of BNB might not inch closer to its all-time high.