

- UNI’s recent bullish trend showed potential support as many addresses were in profit.
- Whale activities and the prevalence of netflow spikes suggested the potential for bull traps.
Uniswap’s [UNI] price action has recently turned bullish, sparking discussions about the longevity of this upward trend, especially because the bulls have pulled several bull traps since the start of the year.
Let’s look into this one.
Given the recent bullish trend in UNI’s price, the current structure shows a potential support level as many addresses are in profit.
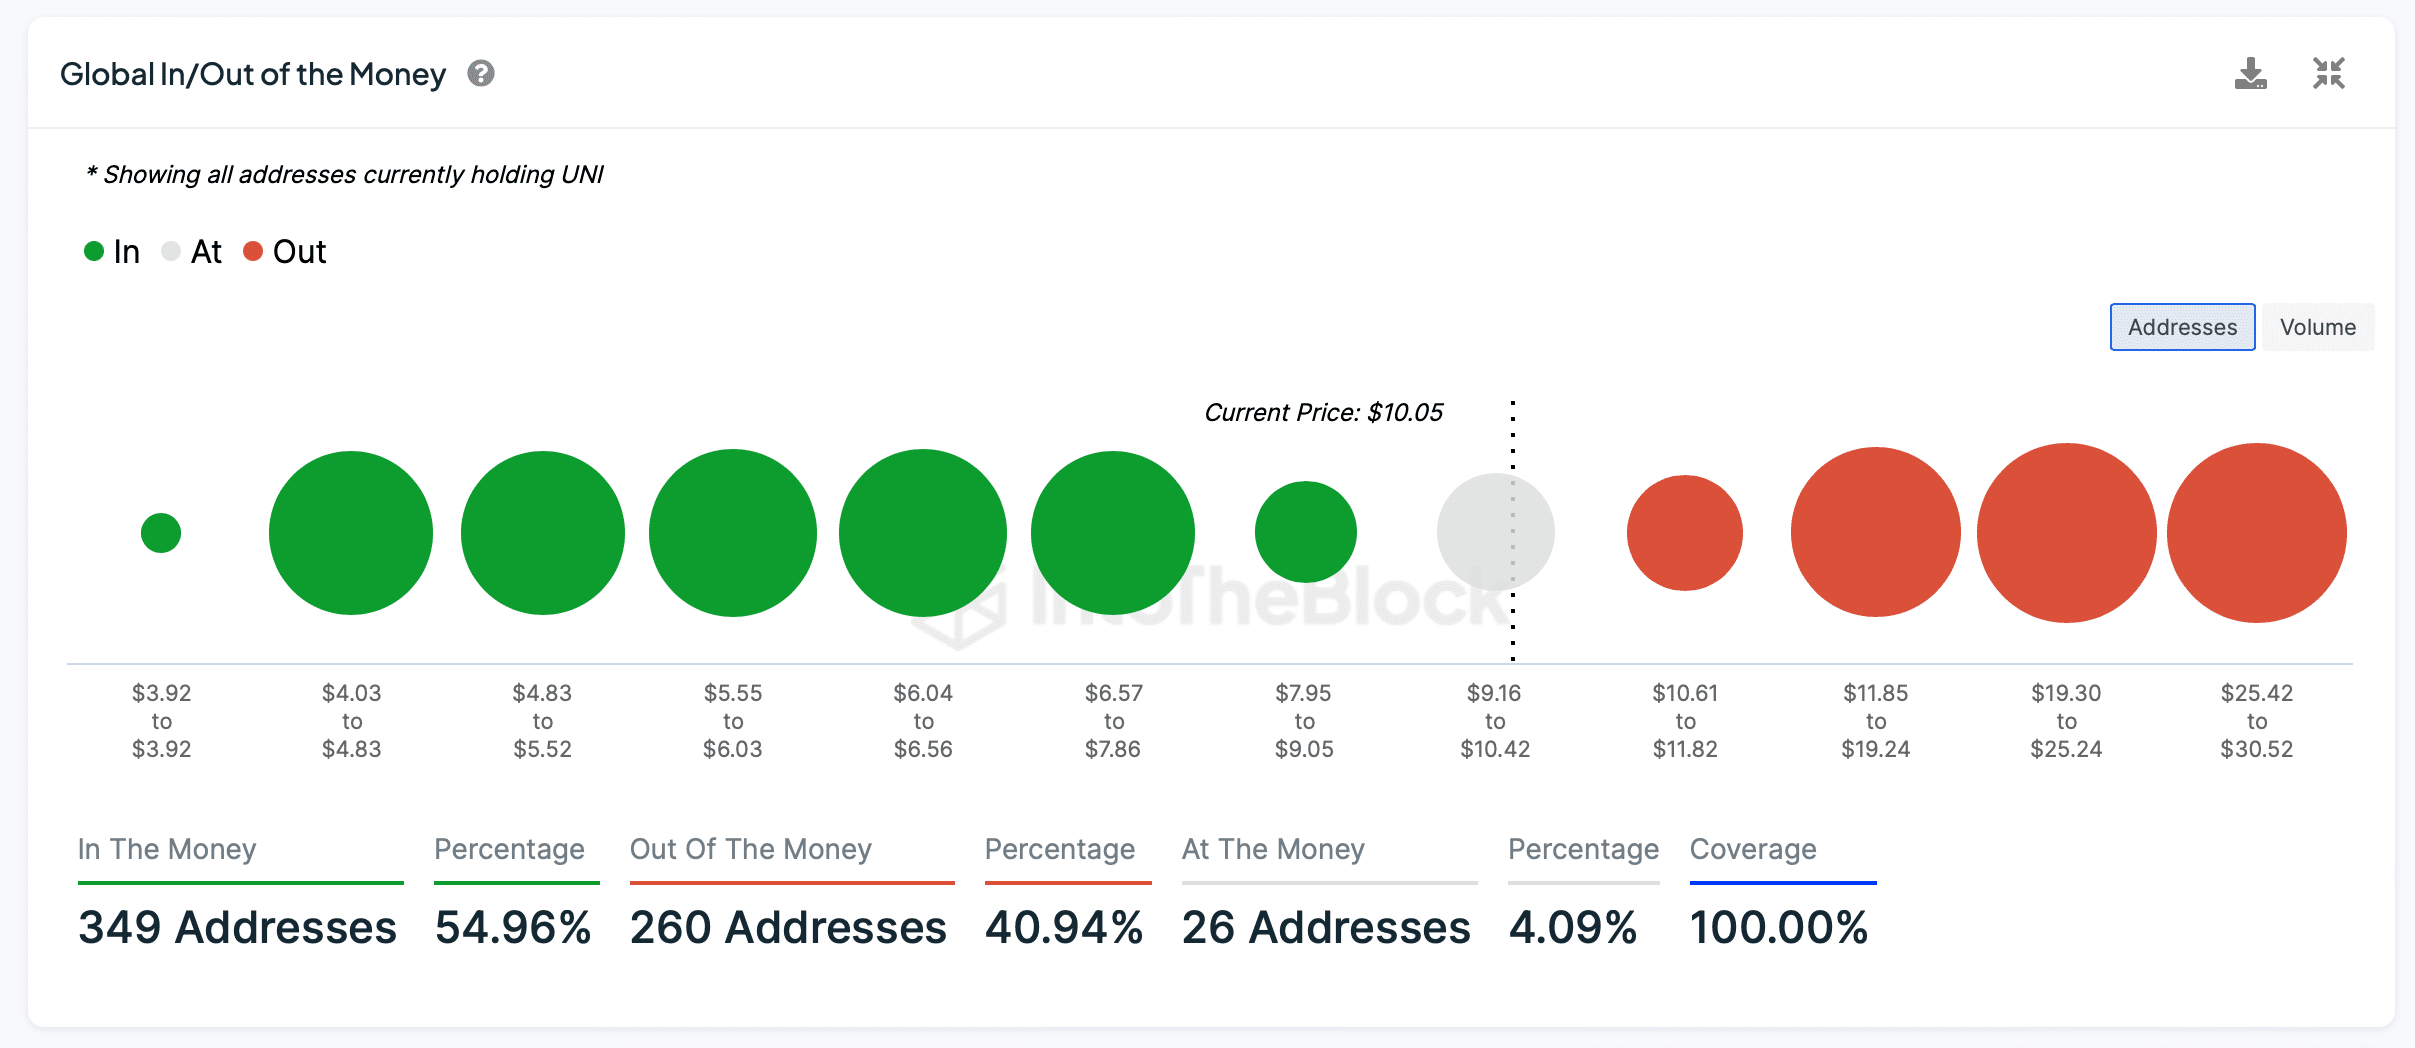
Source: IntoTheBlock
However, the presence of a significant portion of holders out of the money could also mean overhead resistance. These investors might look to exit at break-even points, especially if they’ve been caught in previous bull traps.
The current bullish trend might be subject to reversals if whale holders decide to take profits, leading to sudden price drops.
The dominance of whales suggested that the market was heavily influenced by the actions of a few at press time, which could lead to volatility.
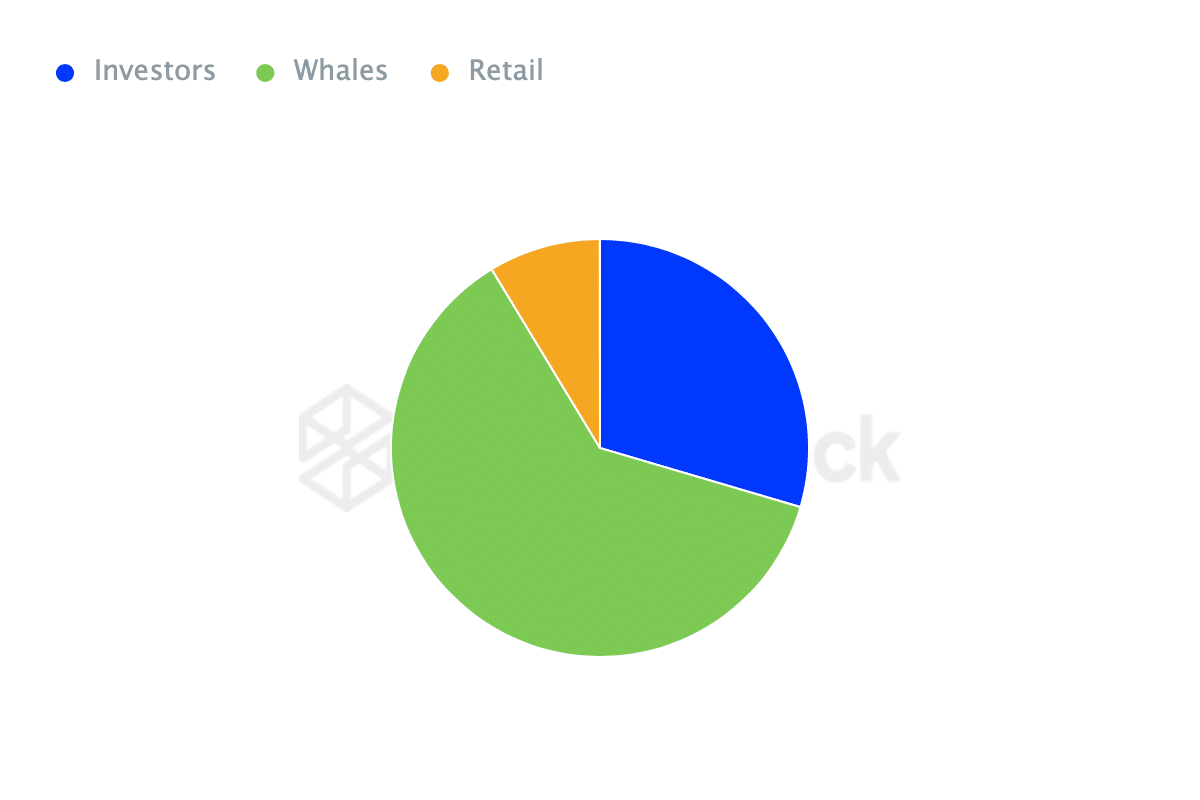
Source: IntoTheBlock
The netflow spikes could be signaling bull traps, where sudden price rises tempt retail investors to buy, only for whales to sell off their holdings, causing the price to crash.
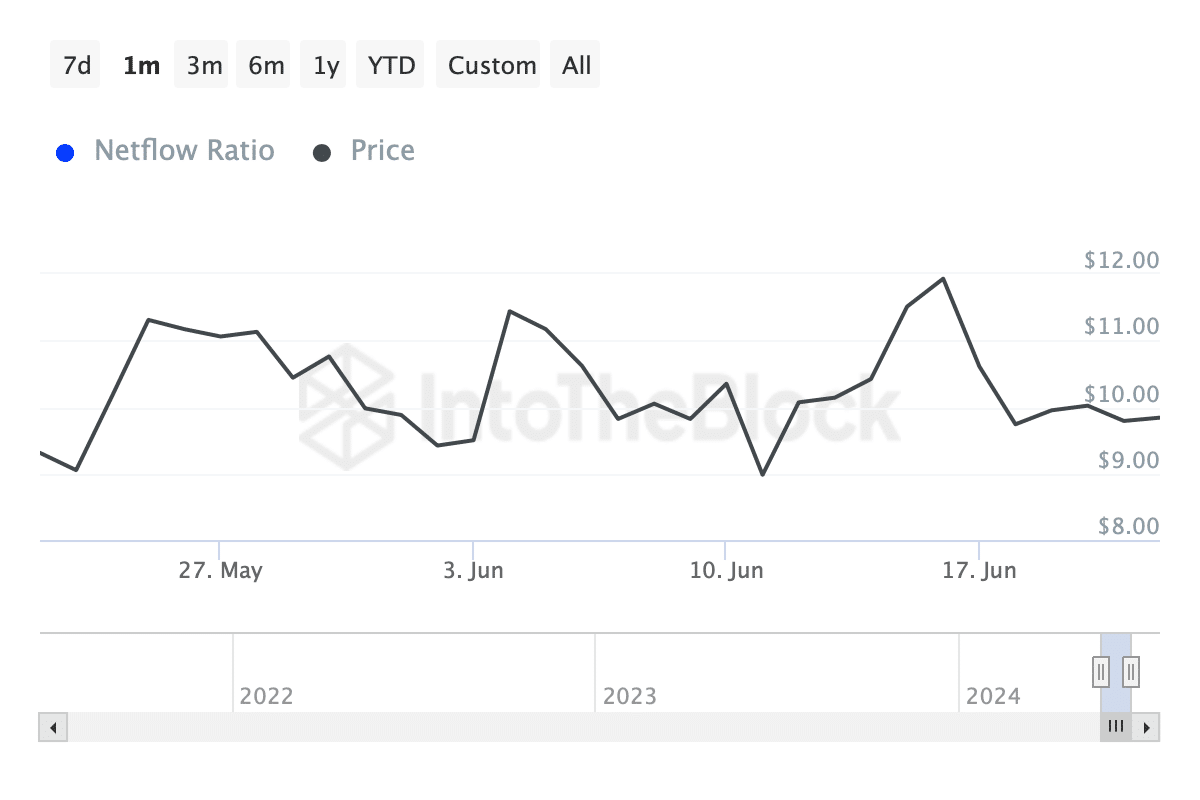
Source: IntoTheBlock
Uniswap’s trading patterns
The 200-period MA appeared to be acting as a dynamic resistance level. Also, UNI tested this level several times and has retreated, suggesting that sustaining gains above this MA might be difficult in the near term.
The widening of the Bollinger Bands around the middle of the chart indicated increased volatility. However, the return to narrower bands suggested stabilization.
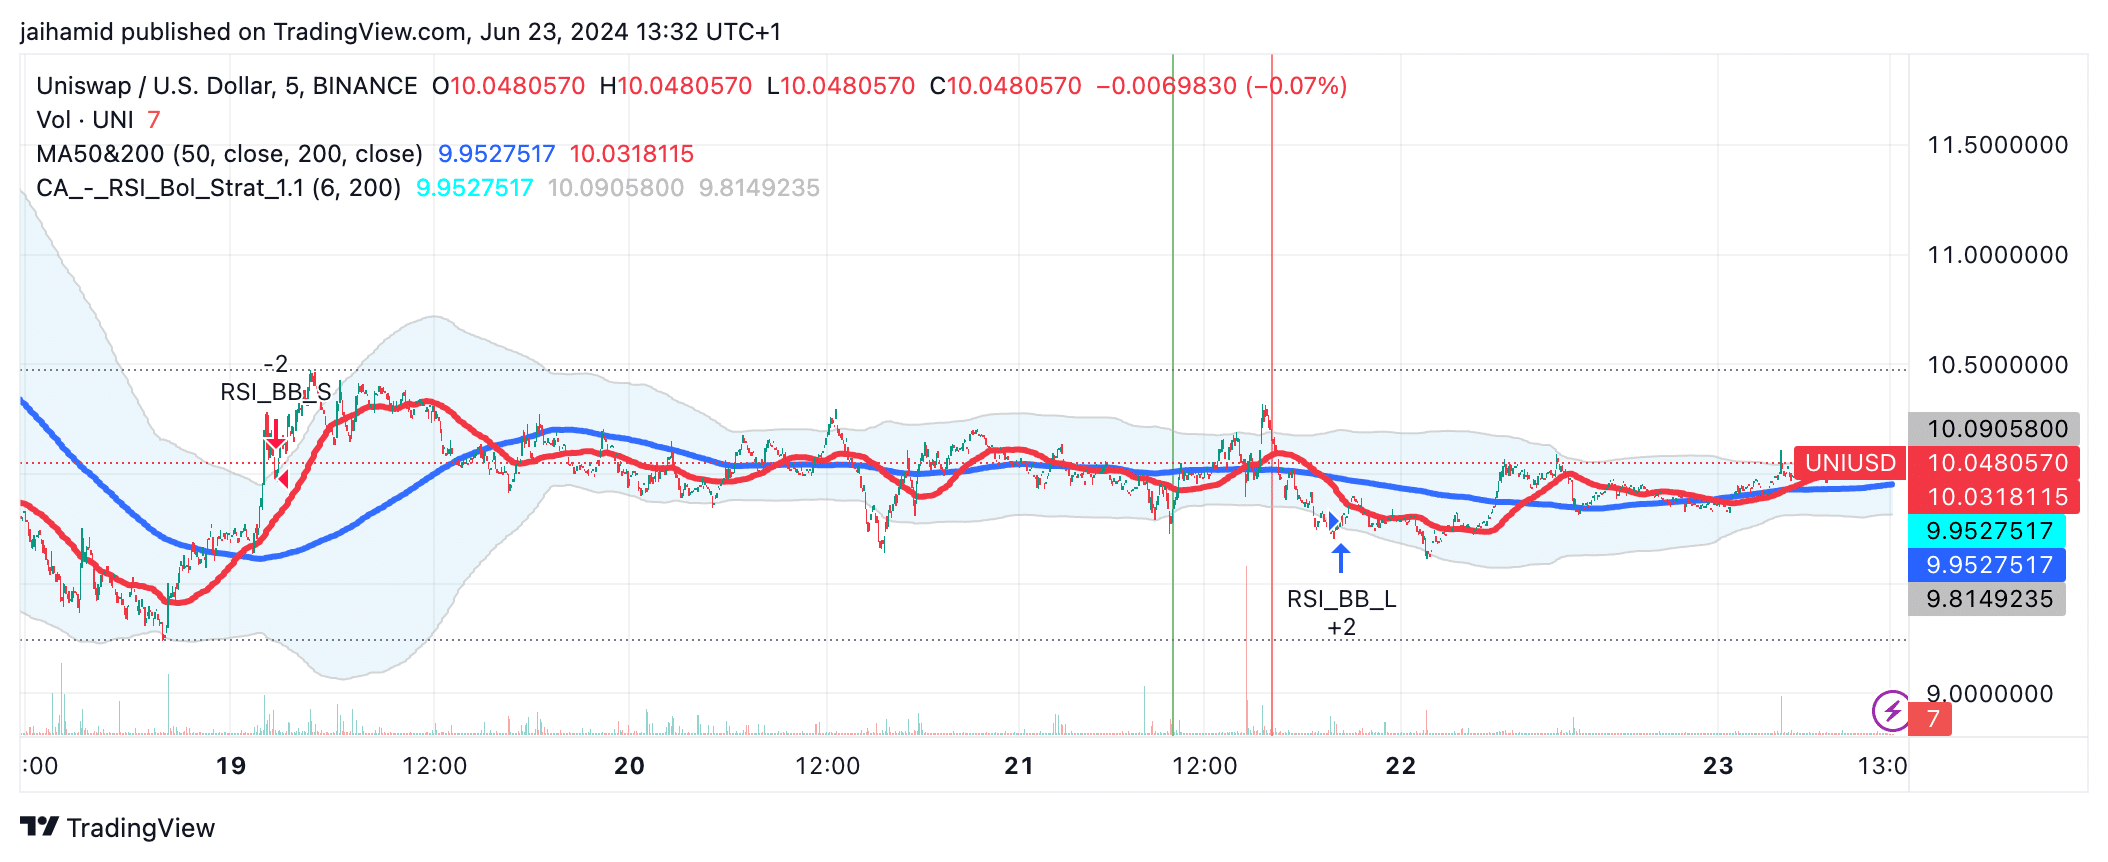
Source: TradingView
Also, UNI saw a double top (a bearish reversal pattern) around the price point of $10.15, suggesting a potential downturn.
The double bottom (bullish reversal pattern) suggested strong support levels that the price has tested twice without breaking lower. It’s identified around the $9.85 level, indicating huge potential for the pattern to hold.
Is your portfolio green? Check out the UNI Profit Calculator
The frequent change in the direction indicated by the HH, HL, LH, and LL marks, along with the close proximity of double top and double bottom patterns, means high intraday volatility.
This is typical of markets influenced by news or significant trader activity.