

- Dogwifhat has traded within a descending channel since the end of May.
- If the memecoin’s bulls fail to defend the support level, its value may plunge further.
Dogwifhat [WIF] may be poised for a rebound as it falls toward the lower line of its descending channel.
The popular dog-themed memecoin has trended in a descending channel since 29th May after it closed at $3.67. Exchanging hands at $2.44 at press time, WIF’s price has since declined by 34%.
The bulls and bears must slug it out
When a descending channel is formed, it is a bearish sign that connotes sustained selling pressure.
The upper line of this channel acts as resistance, while the lower line represents support. For WIF, it has faced resistance at $4.10 and has found support at the $2.08 price level.
When an asset’s price falls toward the lower line of the descending channel, it is approaching a level where it previously found support, and the bulls may step in to defend this level.
If the bulls are successful and the support level holds, the asset’s price may rebound toward the upper line at resistance. However, if the support line is breached, it suggests a continuation of the bearish trend, leading to a further decline in an asset’s value.
The WIF market has a significant bearish presence. For example, readings from its Directional Movement Index (DMI) showed its positive directional index (green) resting below its negative index (red).
This confirmed that selling pressure outpaced buying activity among the meme coin holders.
Further, WIF’s Elder-Ray Index has returned only negative values since 7th June. At press time, the indicator’s value was -0.75.
This indicator measures the relationship between the strength of WIF buyers and sellers in the market. When its value is negative, bear power dominates the market.
WIF’s Aroon Down Line was 100%, confirming the strength of the current downtrend. The Aroon indicator identifies an asset’s trend strength and potential reversal points in its price movement.
When an asset’s Aroon Down line is close to 100, it indicates that the downtrend is strong and that the most recent low was reached relatively recently.
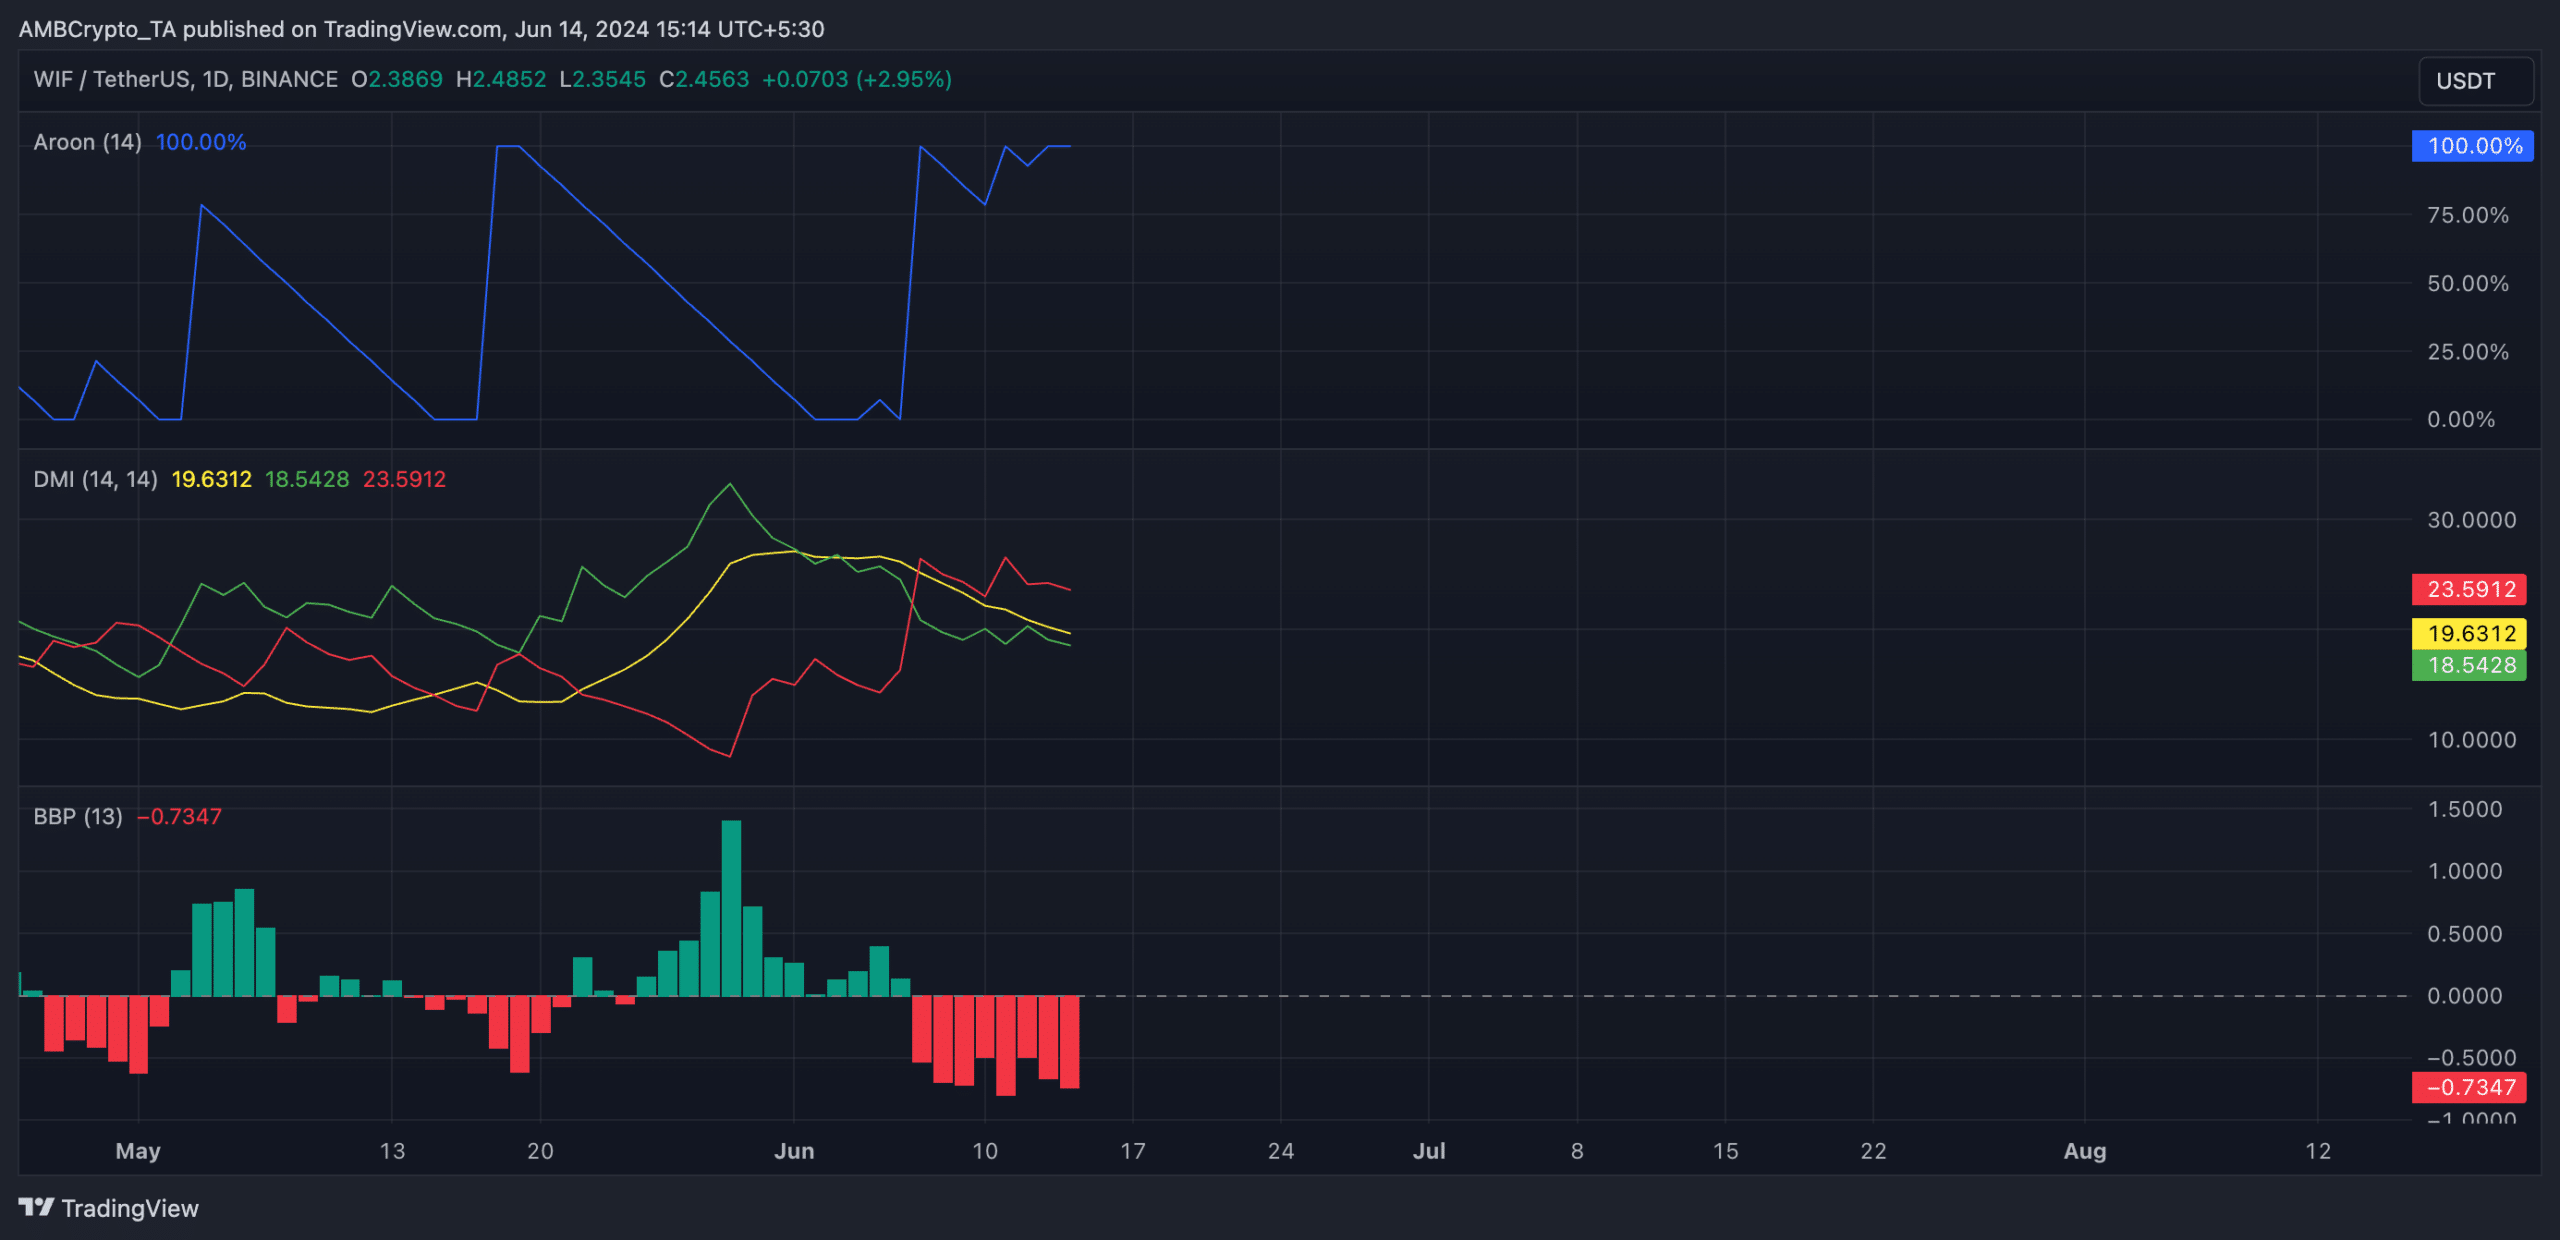
Source: TradingView
Read dogwifhat’s [WIF] Price Prediction 2024-25
If this downtrend continues, WIF may breach support to trade at $1.93.
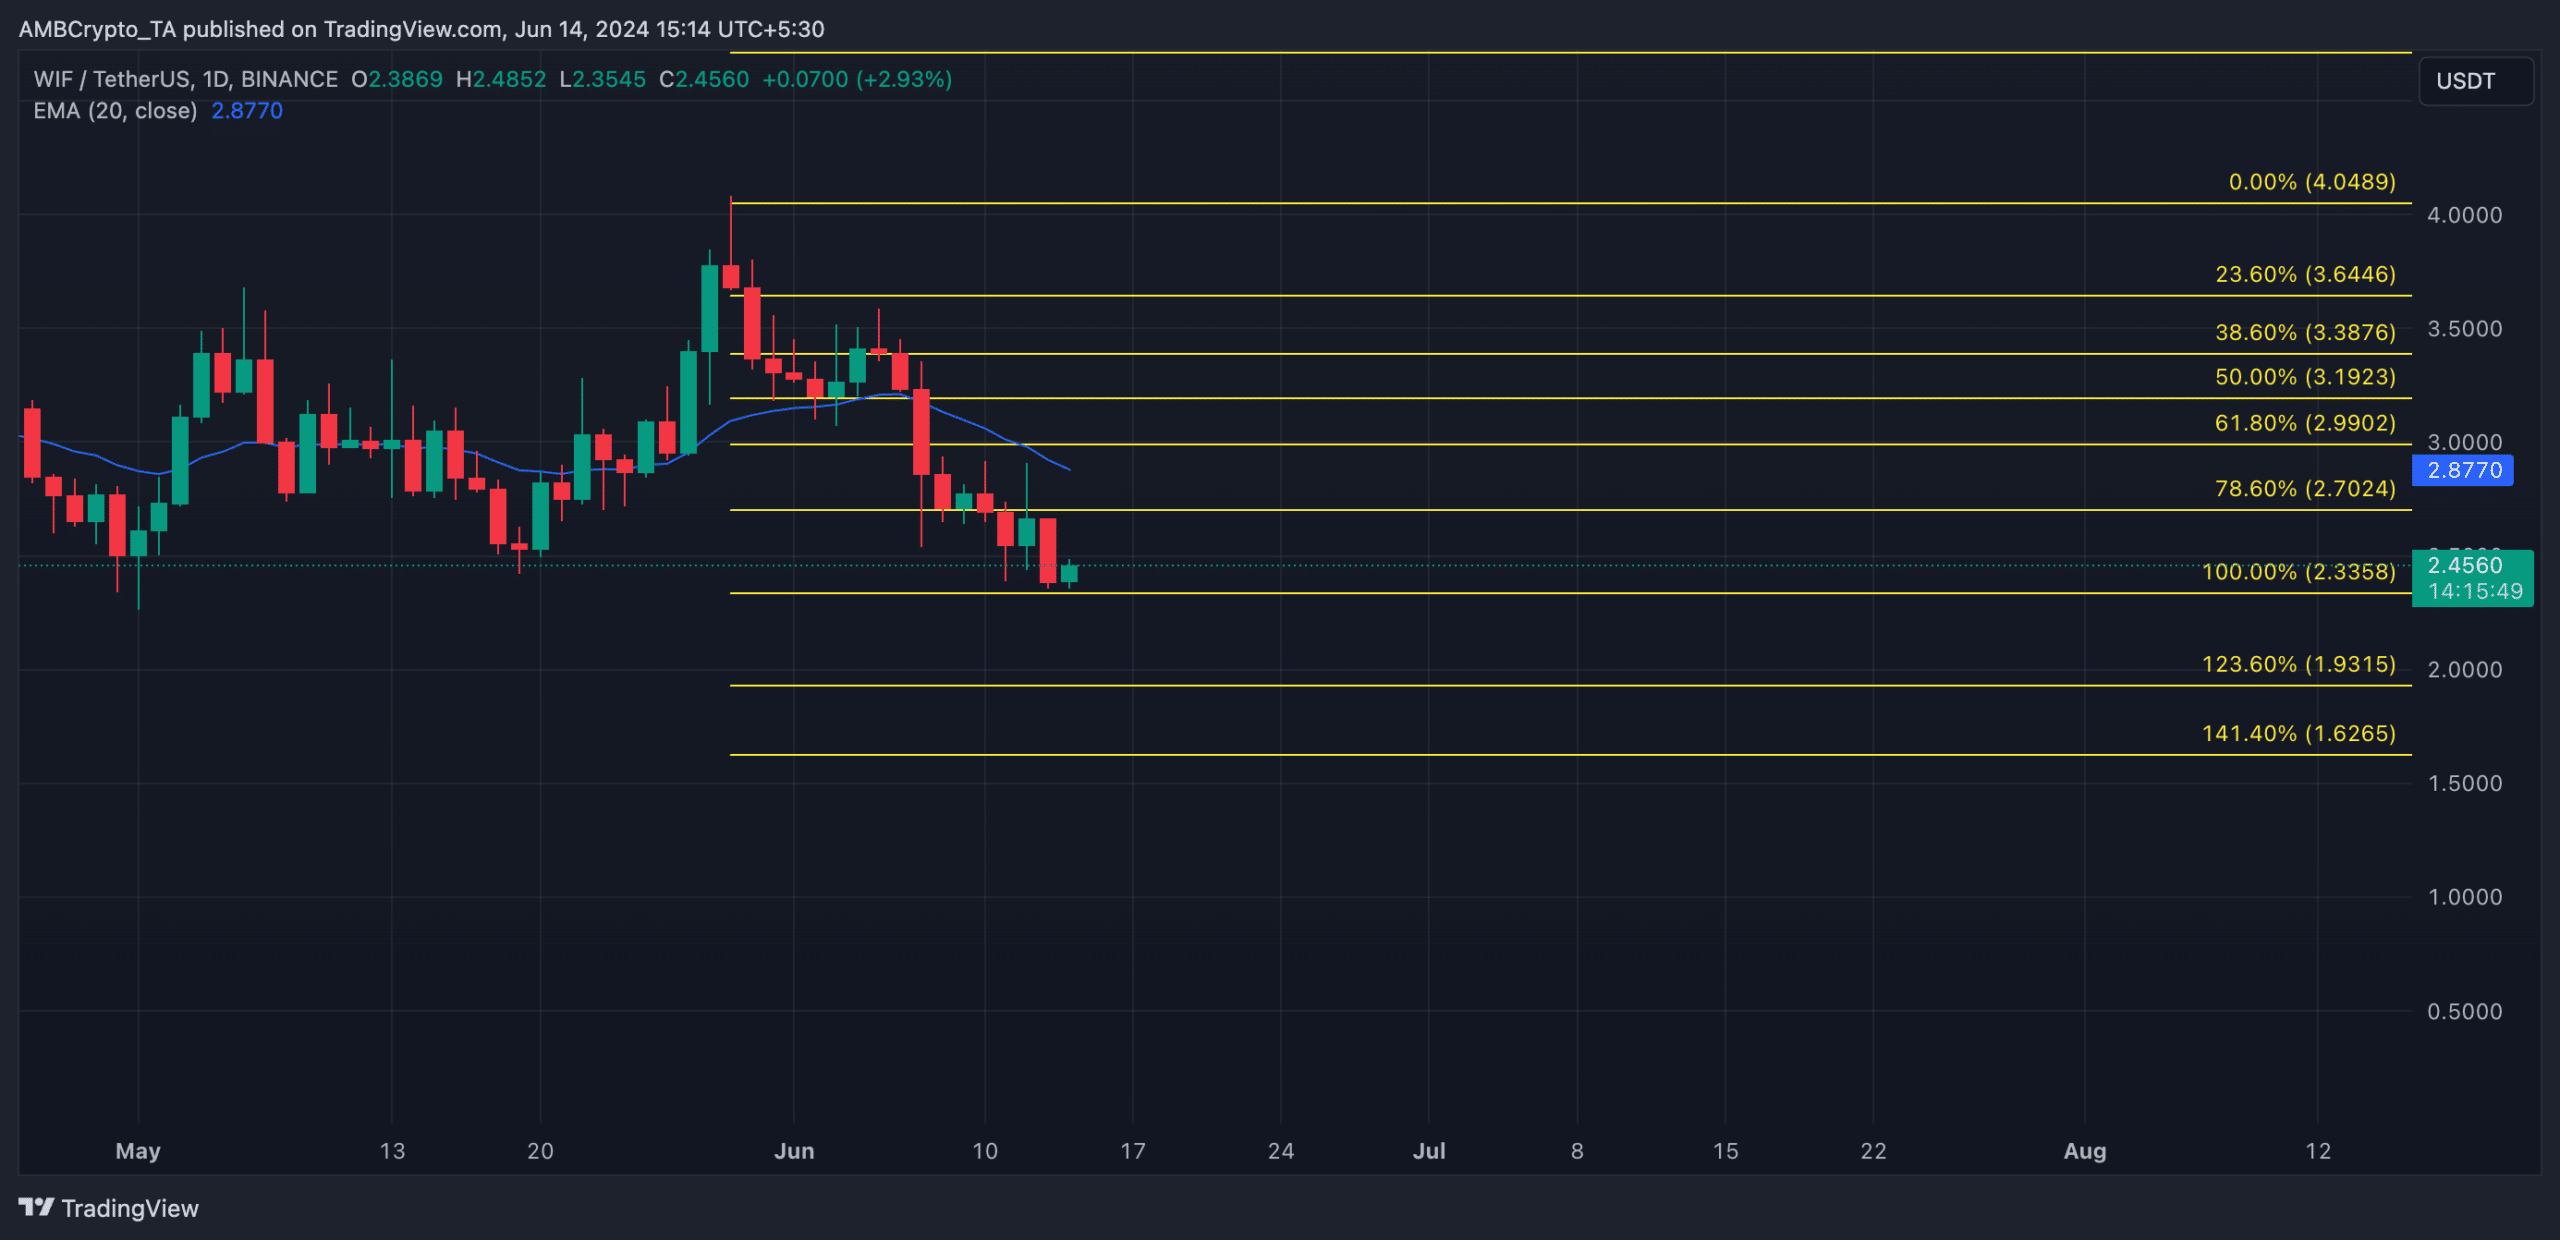
Source: TradingView
However, if the bulls successfully defend the support level and WIF witnesses a rebound, its price may rally toward $2.70.