- Bitcoin’s price increased by more than 2% in the last seven days.
- Most metrics looked bullish on Bitcoin.
Bitcoin [BTC] has not performed per expectations, as the king of cryptos continued to trade under $70k at press time, despite a positive weekly chart.
But there was more to the story, as BTC’s slow-moving price action might be a prelude to a massive price hike in the coming days.
Bitcoin is set to pump
CoinMarketCap’s data revealed that BTC’s price had increased by more than 2% in the last seven days. At the time of writing, BTC was trading at $69,329.89 with a market capitalization of over $1.3 trillion.
Though BTC continued to trade under $70k, the king of cryptos had a trick up its sleeves, which might soon result in a massive bull rally.
Trader Tradigrade, a popular crypto analyst, recently posted a tweet highlighting an interesting development. As per the tweet, BTC’s price was consolidating inside a bullish pennant pattern.
A breakout above could allow BTC to touch new highs.
So, the recent sluggish price movement could just be a result of this consolidation phase.
BTC to $88k?
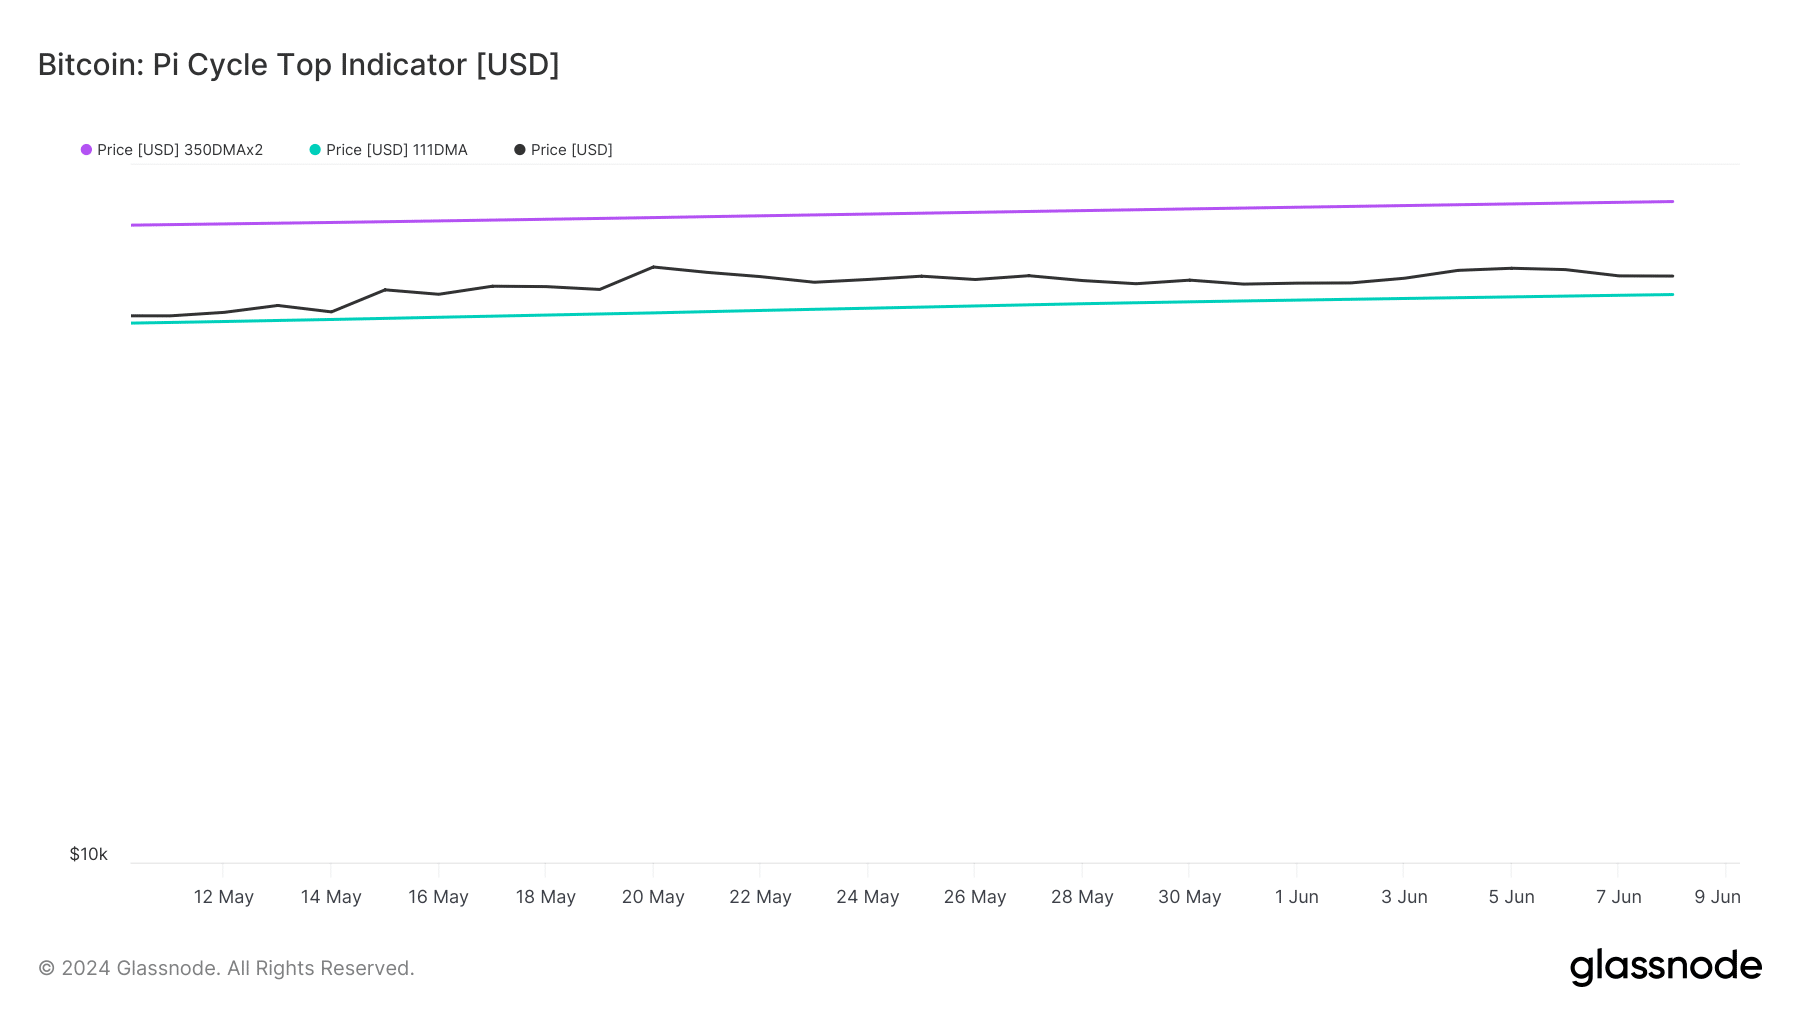
AMBCrypto’s look at Glassnode’s data revealed that BTC had the potential to surge substantially.
To be precise, BTC’s Pi cycle top indicators revealed that BTC was nearing its market bottom, and a price could allow the coin to go above the $88k mark.
For the uninitiated, the Pi Cycle indicator is composed of the 111-day moving average (111SMA) and a 2x multiple of the 350-day moving average of Bitcoin’s price.


Source: Glassnode
AMBCrypto then analyzed CryptoQuant’s data to better understand whether BTC could reach $88k. We found that buying pressure on BTC was high, as its exchange reserve was dropping at press time.
Its Binary CDD remained green, meaning that long-term holders’ movements in the last seven days were lower than average. They have a motive to hold their coins.
Things in the derivatives market also looked pretty optimistic. BTC’s Funding Rate increased, meaning that long-position traders are dominant and are willing to pay short-position traders.
Buying sentiment among derivatives investors was also high, which was evident from its green Taker Buy Sell Ratio.


Source: CryptoQuant
Read Bitcoin’s [BTC] Price Prediction 2024-25
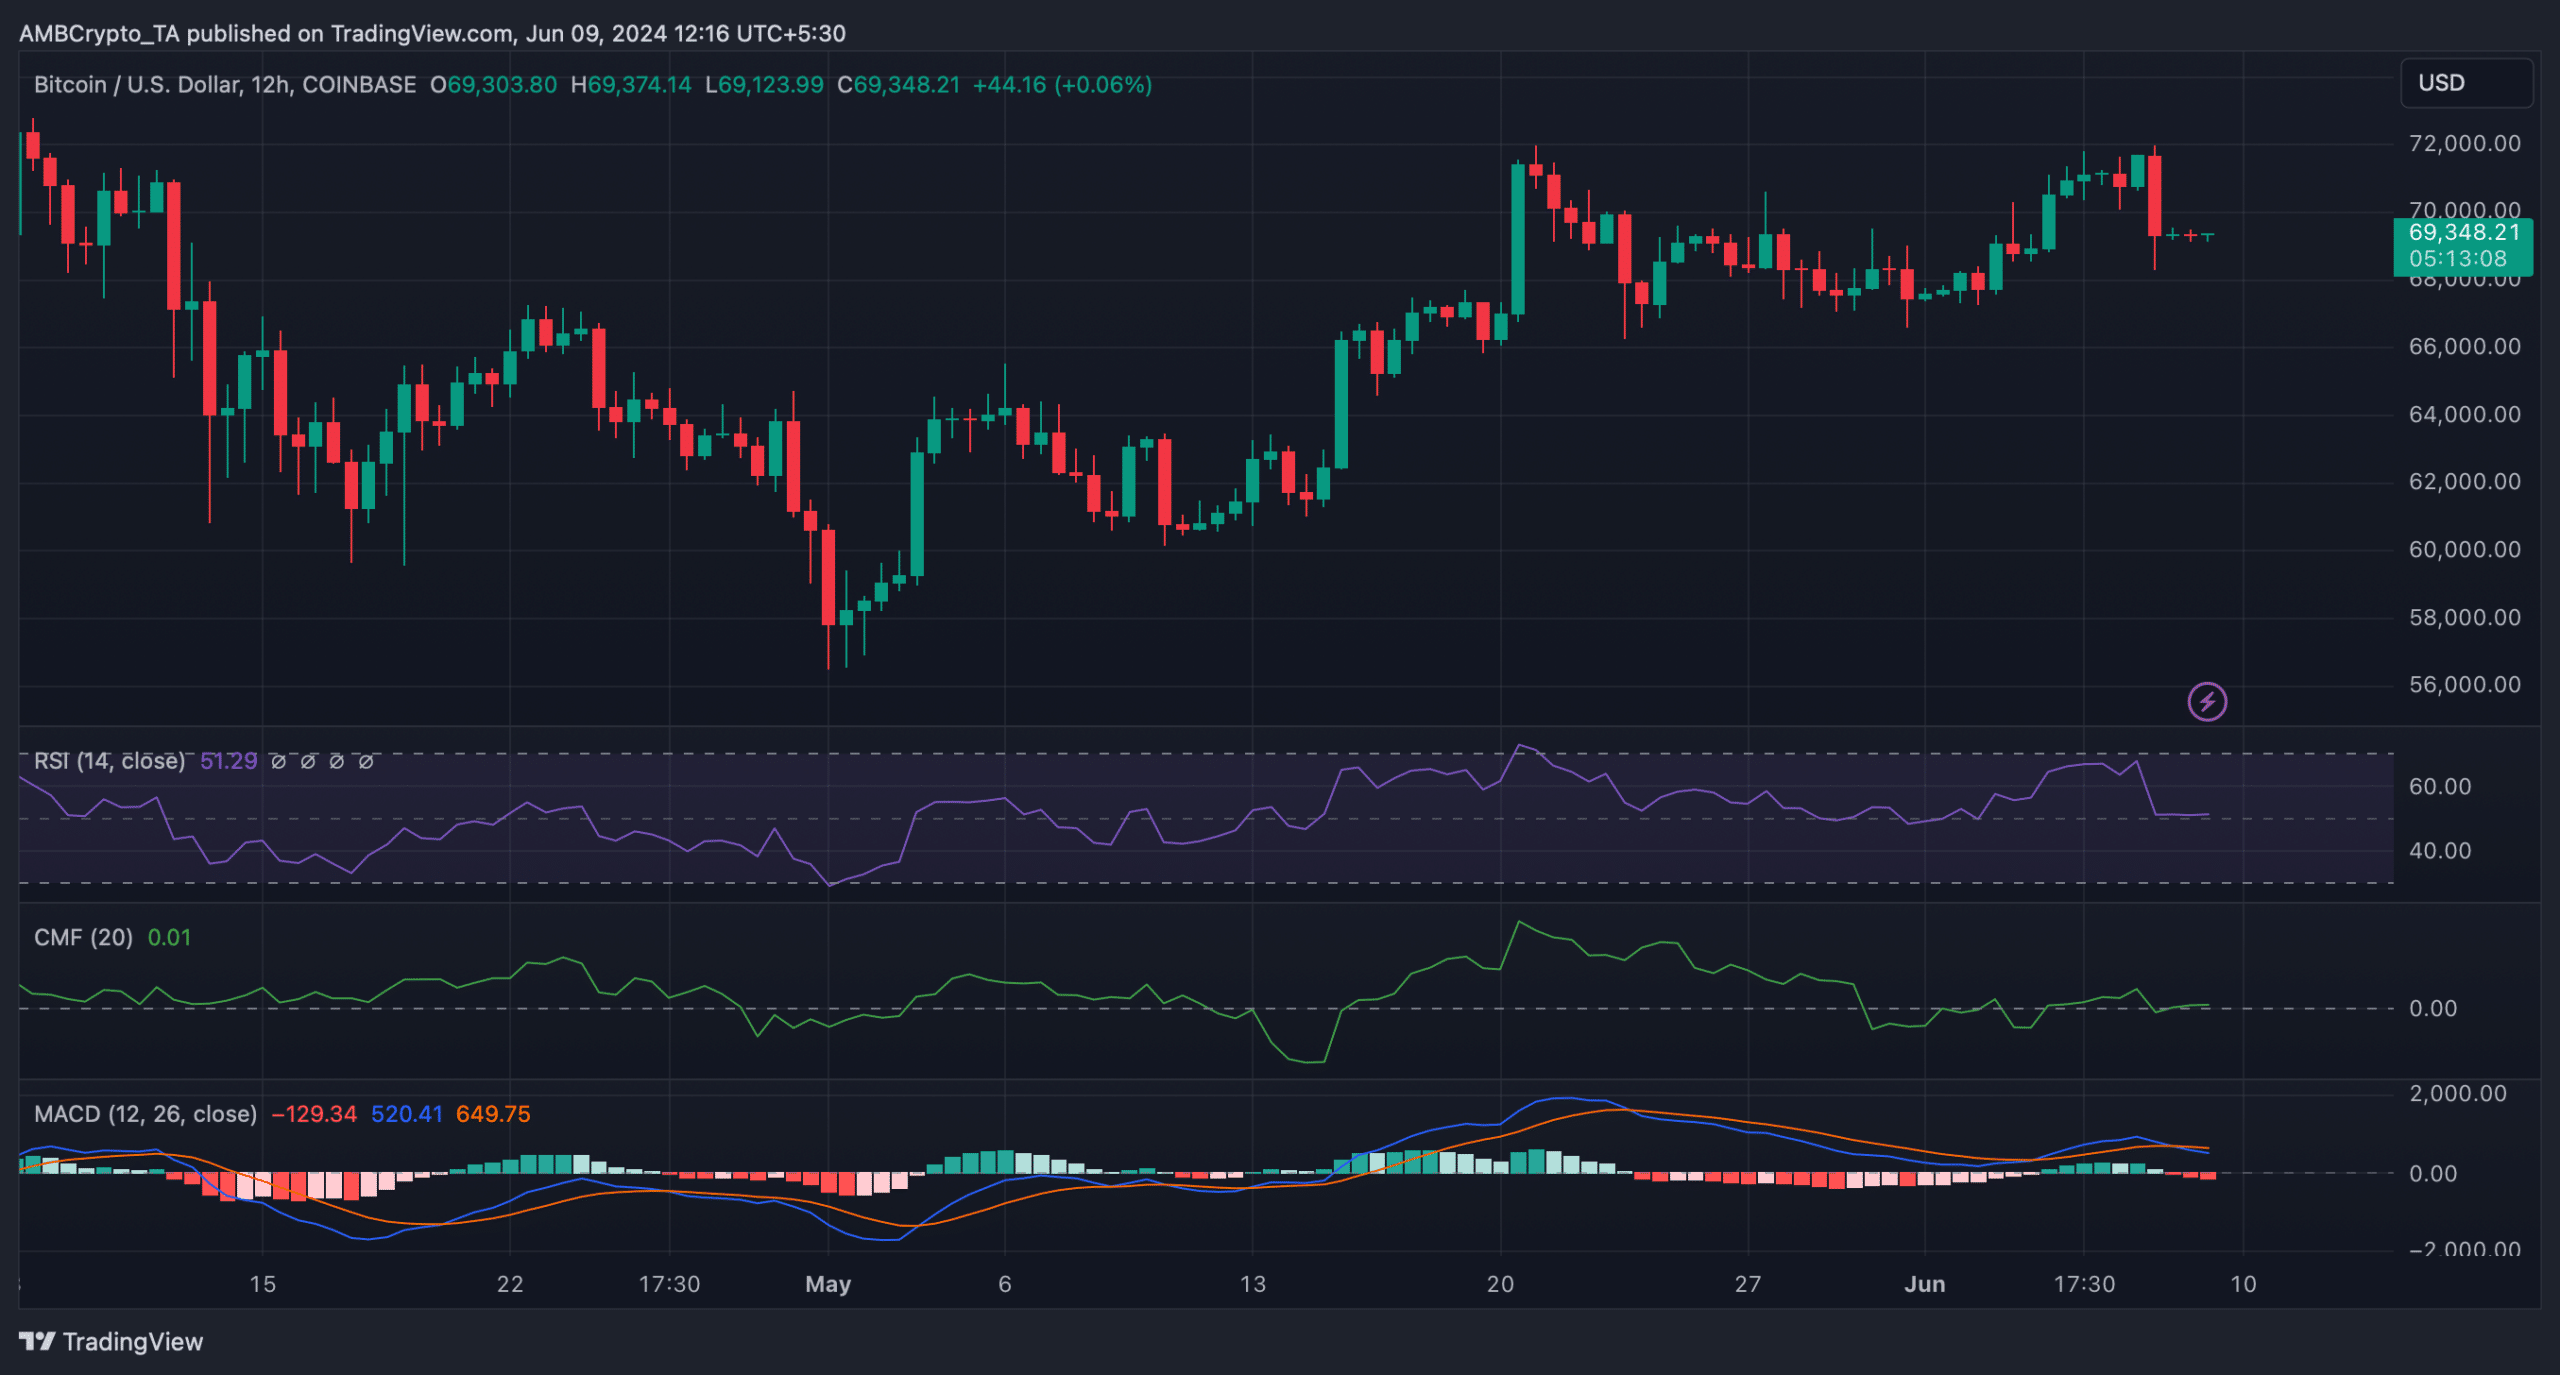
However, investors might have to wait a bit longer to see a Bitcoin pump, as a few indicators hinted at a few more slow-moving days. Notably, the coin’s MACD displayed a bearish crossover.
Moreover, its Relative Strength Index (RSI) and Chaikin Money Flow (CMF) both moved sideways near their respective neutral zones.


Source: TradingView


Leave a Reply