

Legendary trader Peter Brandt says one Bitcoin (BTC) chart looks quite similar to the one printed by the stock market in the mid-1980s before a big breakout.
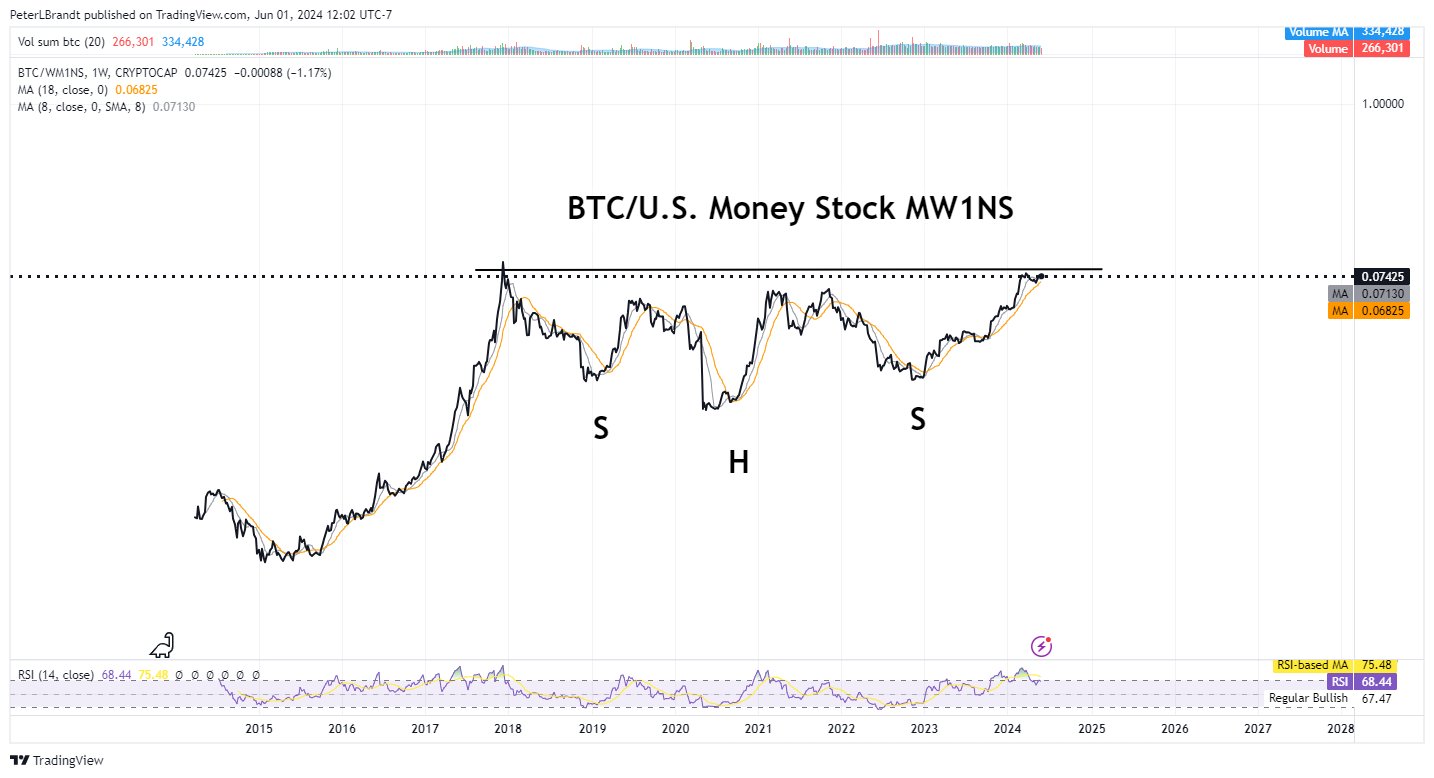
Brandt tells his followers on the social media platform X that he’s looking at Bitcoin versus the M1 money supply chart (BTC/WM1NS), which compares the value of BTC against all the money sloshing in the US economy.
“The argument for Bitcoin relates to the eventual destruction of fiat currency units (e.g., USD) This chart… plots the price of Bitcoin BTC in relationship to total US money stock (M1). This ratio remains below the Dec 2017 high.”
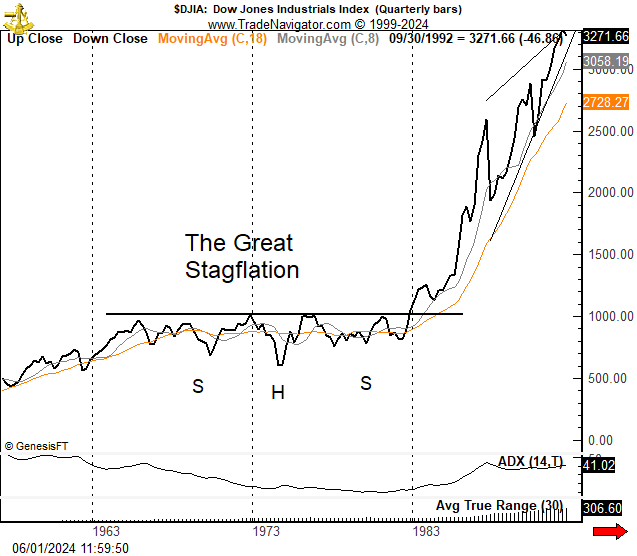
According to Brandt, the BTC/WM1NS chart reminds him of a pattern seen about four decades ago when the Dow Jones Industrial Average (DJIA) index ignited a bull market to end the stagflation of the 1970s.
“Interesting to note similarities in chart structure to DJIA during period of Great Stagflation of 1970s. Some of you will deny the existence of continuation inverted H&S (head and shoulders) – so I will discuss it here. Schabacker (1934) and Edwards and Magee (1948) acknowledge this pattern by name. If the ID is good enough for them, then it is good enough for me.”
An inverted head and shoulders pattern is a bullish formation indicating that buyers are no longer waiting for the price to revisit lows before entering. Should BTC/WM1NS witness a breakout, it would suggest that Bitcoin’s value is significantly outpacing the growing amount of US dollars.
Brandt also predicts that Bitcoin will outperform gold in the coming months.
“Since its inception, Bitcoin BTC has gained against gold. This chart shows the number of ounces of GC (gold) to buy one BTC. The ratio should chop for another 12 to 18 months – then advance to 100 ounces of GC to buy a BTC.”

At time of writing, an ounce of gold is equivalent to $2,329, suggesting a BTC price of more than $230,000 if the ratio hits Brandt’s target.
Bitcoin is trading at $69,055 at time of writing.
Don’t Miss a Beat – Subscribe to get email alerts delivered directly to your inbox
Check Price Action
Follow us on X, Facebook and Telegram
Surf The Daily Hodl Mix
Generated Image: DALLE-3