

- LINK’s price has jumped to correspond to the uptick in its whale and social activity
- However, key metrics suggest that a price bottom might still be in
The value of LINK, the token that powers leading oracle network Chainlink, has surged by double digits in the last 24 hours. Valued at $15.81 at press time, LINK is now trading at its highest level since March, according to CoinMarketCap.
In a post on X (formerly Twitter), on-chain data provider Santiment revealed that LINK’s recent rally has been due to the uptick in its whale activity and social activity.
At the time of writing, 565 LINK whales held over 100,000 tokens – The highest number since October 2023. The count of this investor cohort has rallied steadily since the beginning of May, hiking by 2% in the last 16 days. Over the last month alone, this has grown by 5% too, according to Santiment.
As far as the token’s social activity is concerned, its social dominance currently sits at its highest level in seven months.
This metric tracks social discussions about an asset, compared to the overall discussion about the top 100 cryptocurrencies by market capitalization. With a reading of 1.8% at press time, LINK recorded its highest market share of social discussions since November 2023.
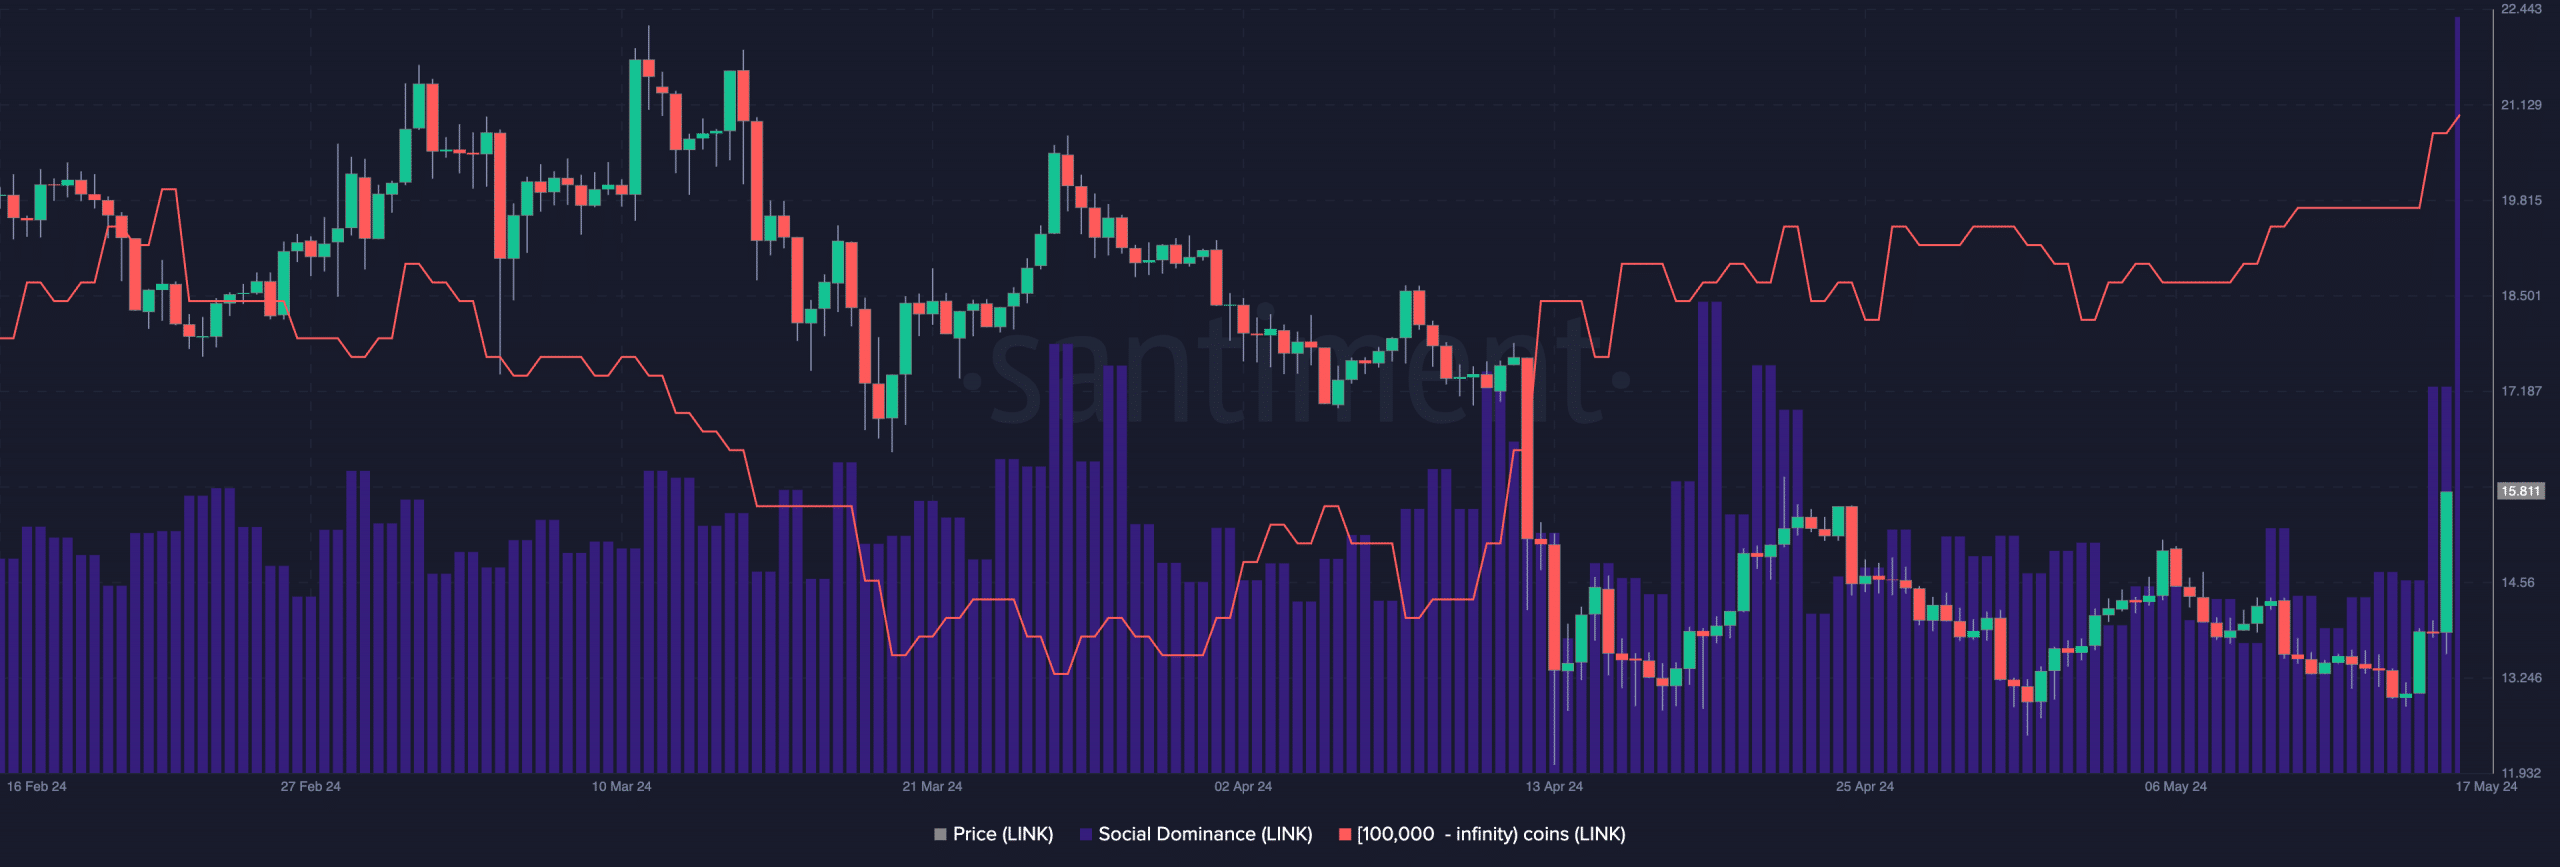
Source: Santiment
LINK enjoys attention
A jump in an asset’s whale and social activity are notable indicators of sustained bullish presence. LINK’s weighted sentiment, which returned a positive value of 1.808 at press time, confirmed this.
Signaling increased demand for the altcoin, its key momentum indicators assessed on a 1-day chart trended upwards at press time too. Also, LINK’s Relative Strength Index (RSI) was 60.67, while its Money Flow Index (MFI) was 62.99.
At these values, these indicators suggested that LINK accumulation exceeded sell-offs among market participants.
Further confirming the bullish trend, LINK’s price closed above its 20-day Exponential Moving Average (EMA) on 16 May. In fact, it was trading above that key level, at the time of writing.
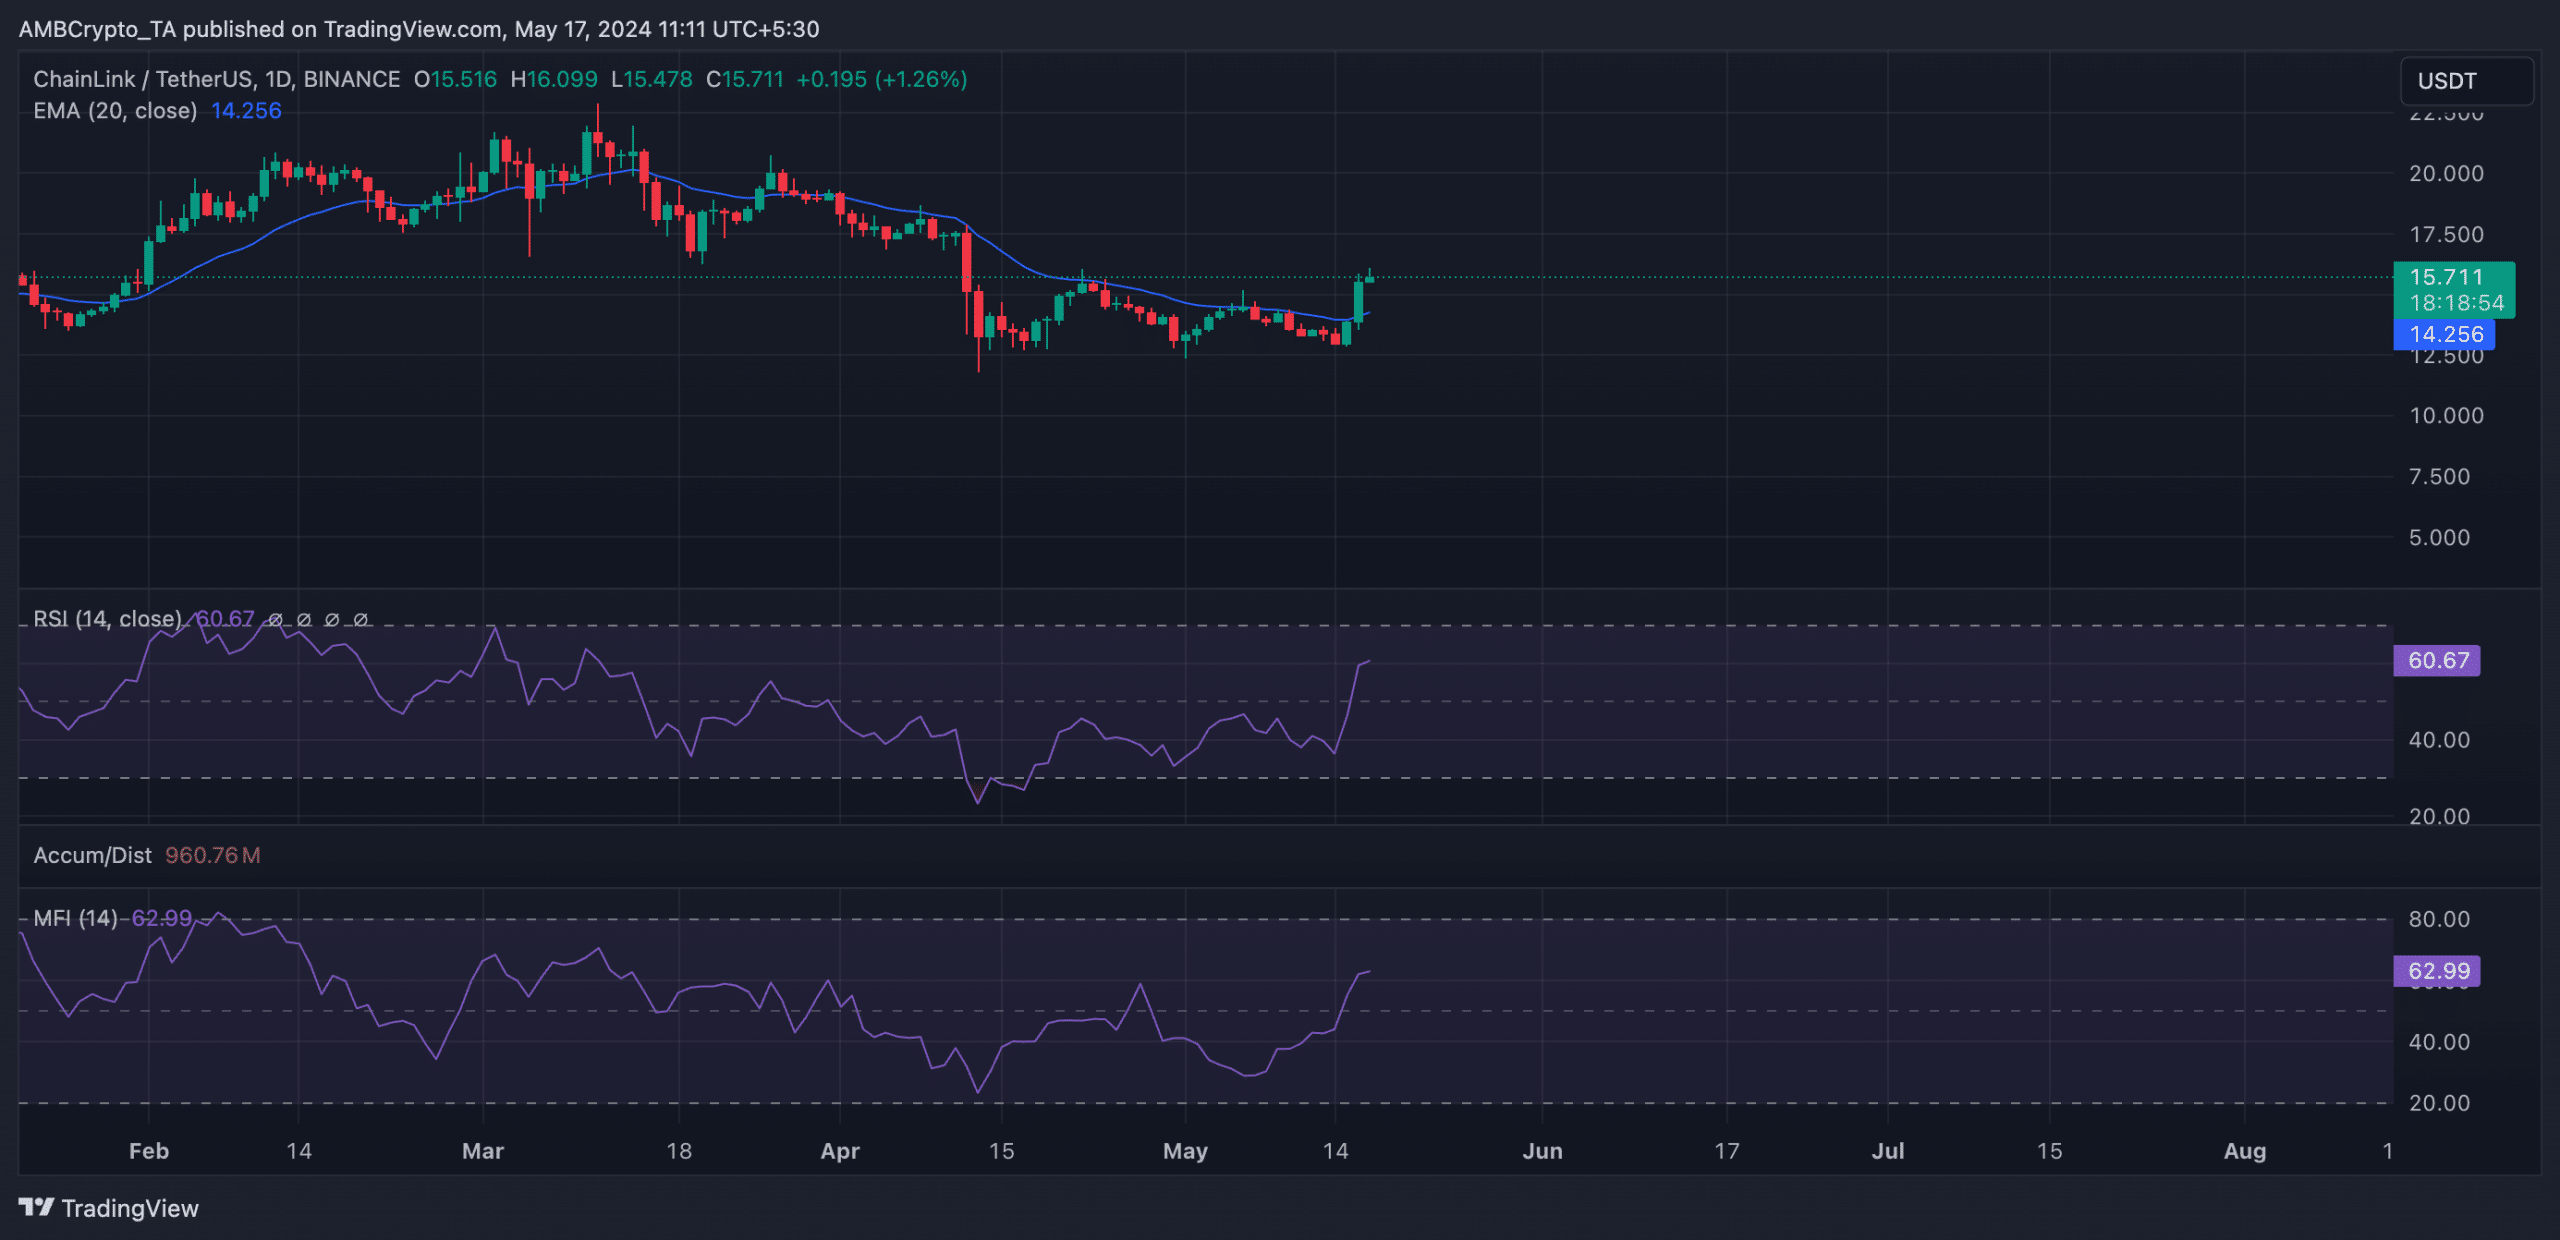
Source: LINK/USDT on TradingView
This is a bullish signal because it shows that LINK’s price has grown past its average price of the past 20 days. Market participants interpret the crossover as a shift in momentum from bearish to bullish.
Price bottom may not be in yet
While the current rally marks a shift in market sentiment towards LINK, there is no confirmation on-chain that a price bottom has been reached yet.
A good metric to assess this is the token’s Age Consumed, which tracks the movement of dormant LINK tokens.
The metric is important because it offers insights into the behavioral patterns of the token’s long-term holders. This category of investors rarely moves their tokens around. Therefore, when they do, it often results in a shift in market trends.
Is your portfolio green? Check out the LINK Profit Calculator
When LINK’s Age Consumed metric spikes, it means that many tokens that have been left idle for a long time are changing hands. On the other hand, when it falls, it means that idle coins are left unmoved.
Since the beginning of May, LINK’s Age Consumed has returned relatively low values – A sign that its long-term holders have barely moved their tokens around.
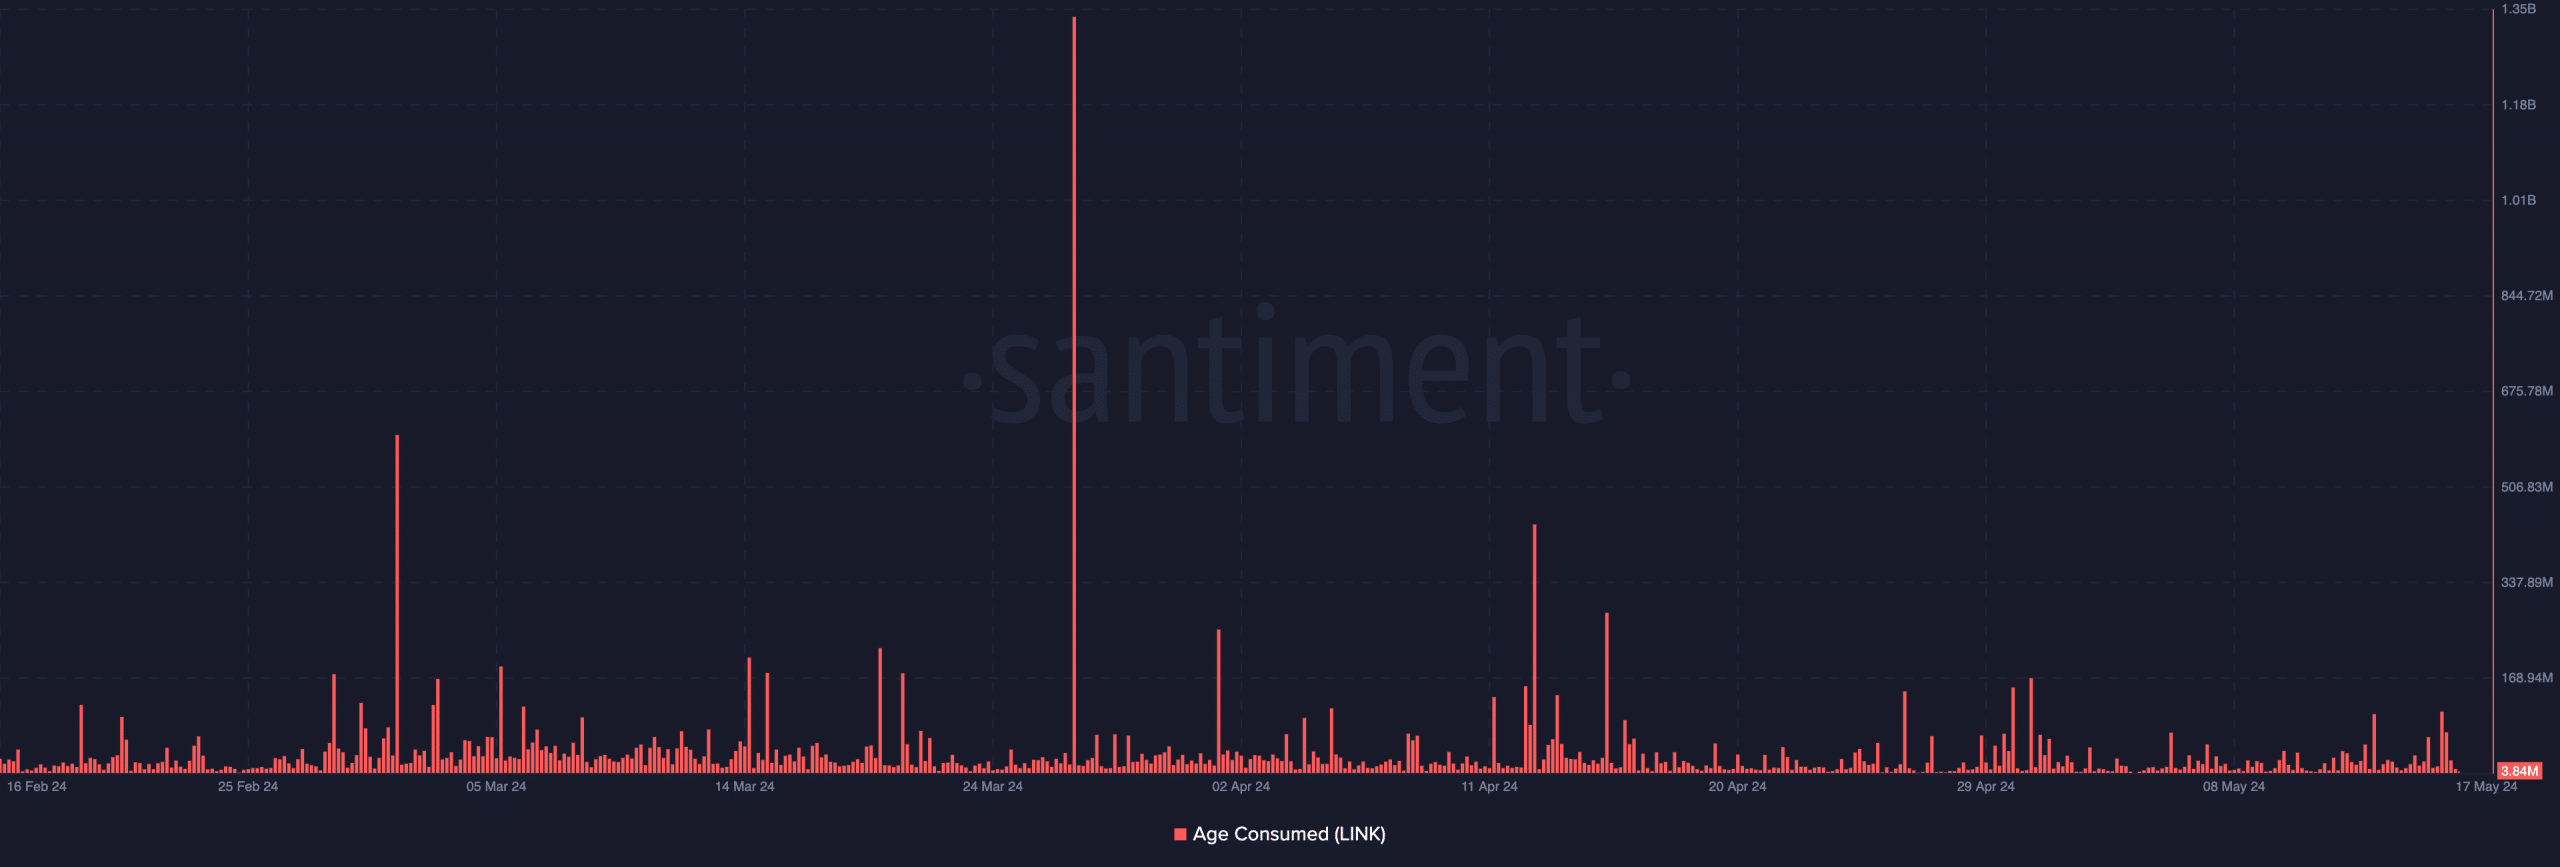
Source: Santiment
Hence, there has been no significant shift in LINK’s market trends, especially in relation to the token’s long-term holders.