- ORDI surged immediately after Bitcoin’s halving
- However, metrics suggest its price rally may be short-lived on the charts
Cryptocurrency token ORDI, closely linked to the Bitcoin Ordinals protocol, has recorded a double-digit price rally over the last 24 hours, according to CoinMarketCap. The token’s price hike follows the completion of Bitcoin’s fourth halving event during the early trading hours of 20 April and the launch of the Runes Protocol.
The Runes protocol, created by Bitcoin Ordinals originator Casey Rodmarmor, is a new way to create fungible tokens on the Bitcoin blockchain. Its launch coincided with the Bitcoin halving event, sending transaction fees to new highs as users tried to “etch” and mint new tokens on the network.
According to Rune Alpha, 1447 Runes had been “etched” on the Bitcoin network at press time, and $16.41 million had been spent on fees.
Will ORDI extend its gains?
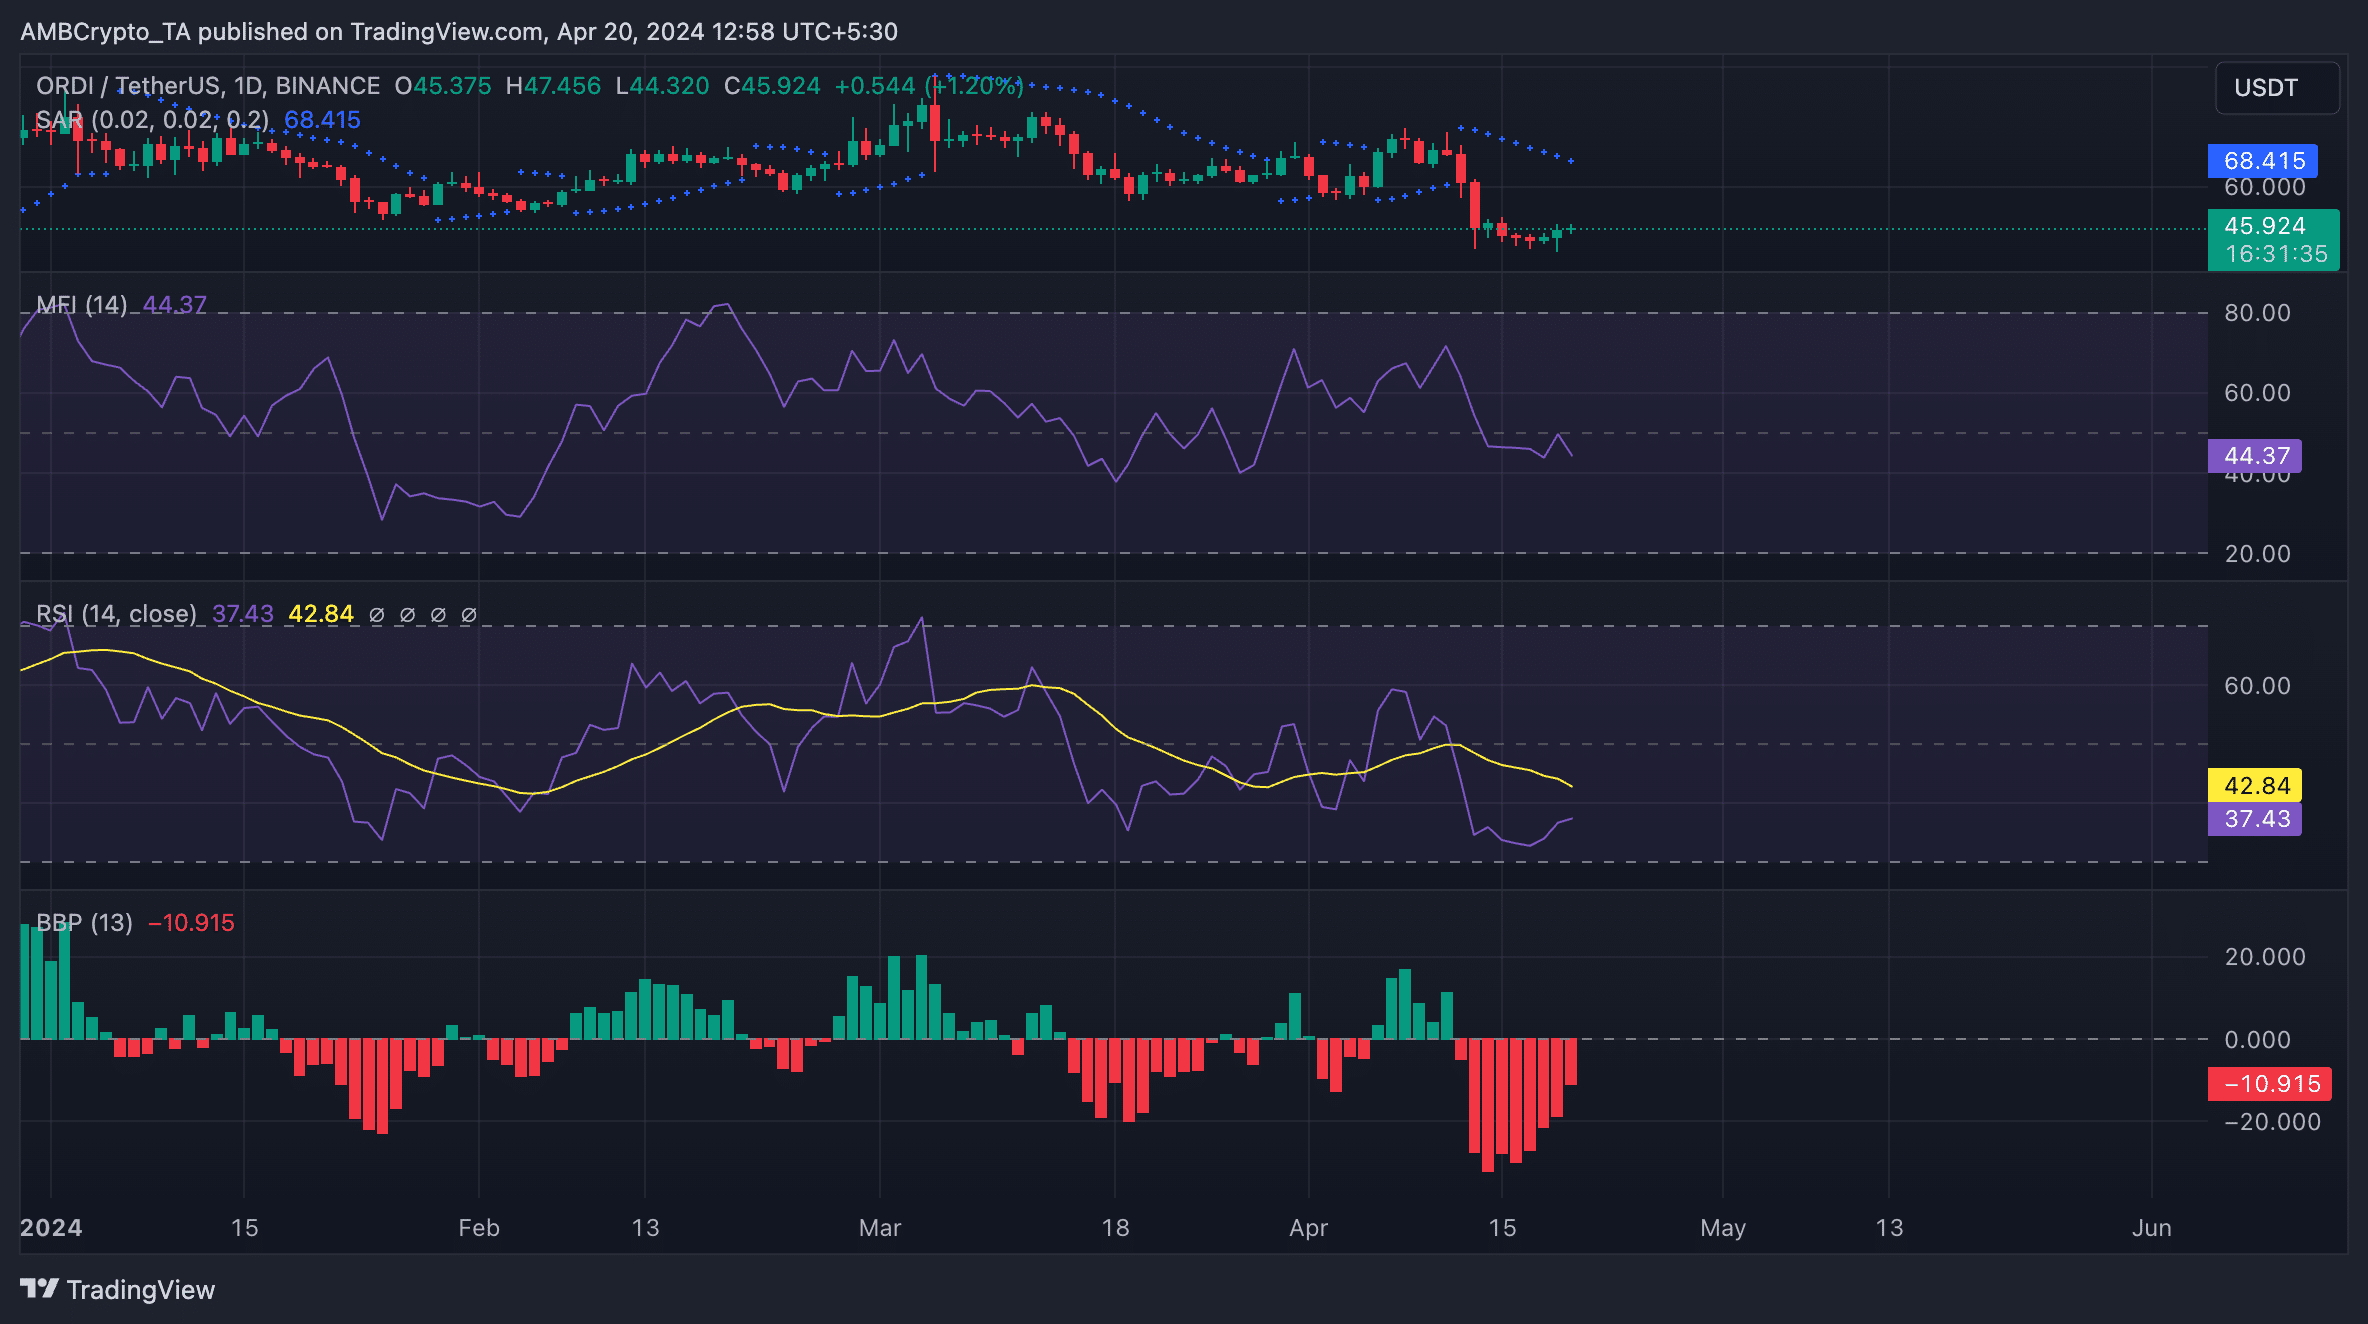
An assessment of ORDI’s key indicators on the 24-hour chart suggested that the price gains may be short-lived as demand for the token remains significantly low. In fact, readings from its key momentum indicators revealed that market participants favoured token sell-offs over accumulation. For example, its Relative Strength Index (RSI) had a reading of 37.46 while its Money Flow Index (MFI) had one of 44.36.
On a downtrend at press time, the values of these indicators highlighted that selling pressure significantly outpaced buying activity.
Furthermore, the token’s Elder-Ray Index, which measures its bull/bear power, revealed that bearish sentiment was significant. The indicator has returned only negative values since 12 April. When this indicator trends in this manner, it suggests that the market is on a downtrend, and there is a possibility that the decline will continue.
Likewise, the dots that make up ORDI’s Parabolic SAR indicator were pegged above its price. This indicator identifies an asset’s potential trend direction and reversals.
When its dots are above an asset’s price, the market is said to be in a decline. It indicates that the asset’s price has been falling and may continue to do so.


Source: ORDI/USDT on TradingView
Is your portfolio green? Check out the ORDI Profit Calculator
Shorters take position
In ORDI’s Futures market, its open interest climbed by 10% in the last 24 hours, as per Coinglass data. At press time, ORDI’s Futures open interest was $211 million.
However, its funding rate across crypto-exchanges was negative during the same period. This underlined that while Futures market participants have taken up trading positions, they have placed bets in favor of ORDI’s price fall.


Leave a Reply