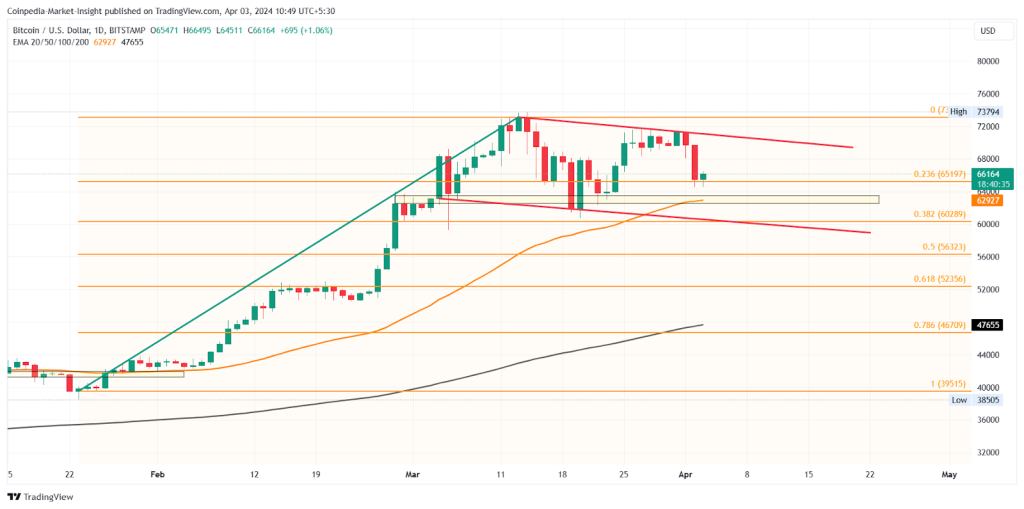
The price of a single Bitcoin falls by 6% this Tuesday, leading to an overall drop of 8% this week. The sellers gain control over the short-term BTC price trend amidst the market-wide sell-off spree, powering a crash in altcoins.
As the supply wave recedes a bit as it tests the $65K mark, the BTC price takes a short relief, putting an intraday growth of 1%. However, the larger picture speaks of a bullish entry despite the correction due to a price pattern.
Further, with the US Bitcoin Spot ETFs hitting a daily net inflow of $40 million this Tuesday, the recovery chances are getting stronger. But will the bulls survive the fall and hit the Bitcoin price prediction of $100,000 before the halving?
Bitcoin Price Performance
With a 6% rise last week, the BTC price trend has lost the recovery momentum this week. Bitcoin is trading at a discount of 8% at $66,120 and has recently tested the crucial support of $65,000.


With two consecutive bearish candles, the daily chart of Bitcoin showcases a negative cycle at play. The downfall is inching closer to the dynamic support of the 50-day EMA as it rests at the 23.60% Fib level.
The 6% drop this Tuesday leads to a $357 million long-liquidation and sets a strong bearish tone in the short term, per Coinglass.
Chances Of BTC Price Hitting $100K This Month
As per the BTC price action, the long-term trend showcases a bearish channel consolidation. However, Bitcoin forms a bullish flag pattern with the prevailing bull run, teasing a trend continuation.
Further, with the resurfacing daily net inflows and the upcoming Bitcoin halving, the price of a single BTC could exceed $75,000. However, the market value reaching the $100,000 mark seems like a post-halving target under present market conditions.
On the flip side, a correction under the 50D EMA could test the 38.20% Fibonacci level at $60,289.


Leave a Reply