- Daily active wallets on Cardano have climbed to a yearly high
- ADA at risk of decline as bears attempt to regain market control
In the past 30 days, the number of active wallets on Cardano [ADA] has reached a one-year peak of over 600,000, Danogo, a decentralized exchange (DEX) built on the Layer 1 (L1) network, noted in a recent post on X (formerly Twitter).
As of 15th March, the active address count on Cardano totaled 618,000, a 16% increase from the 533,000 recorded at the beginning of the month.
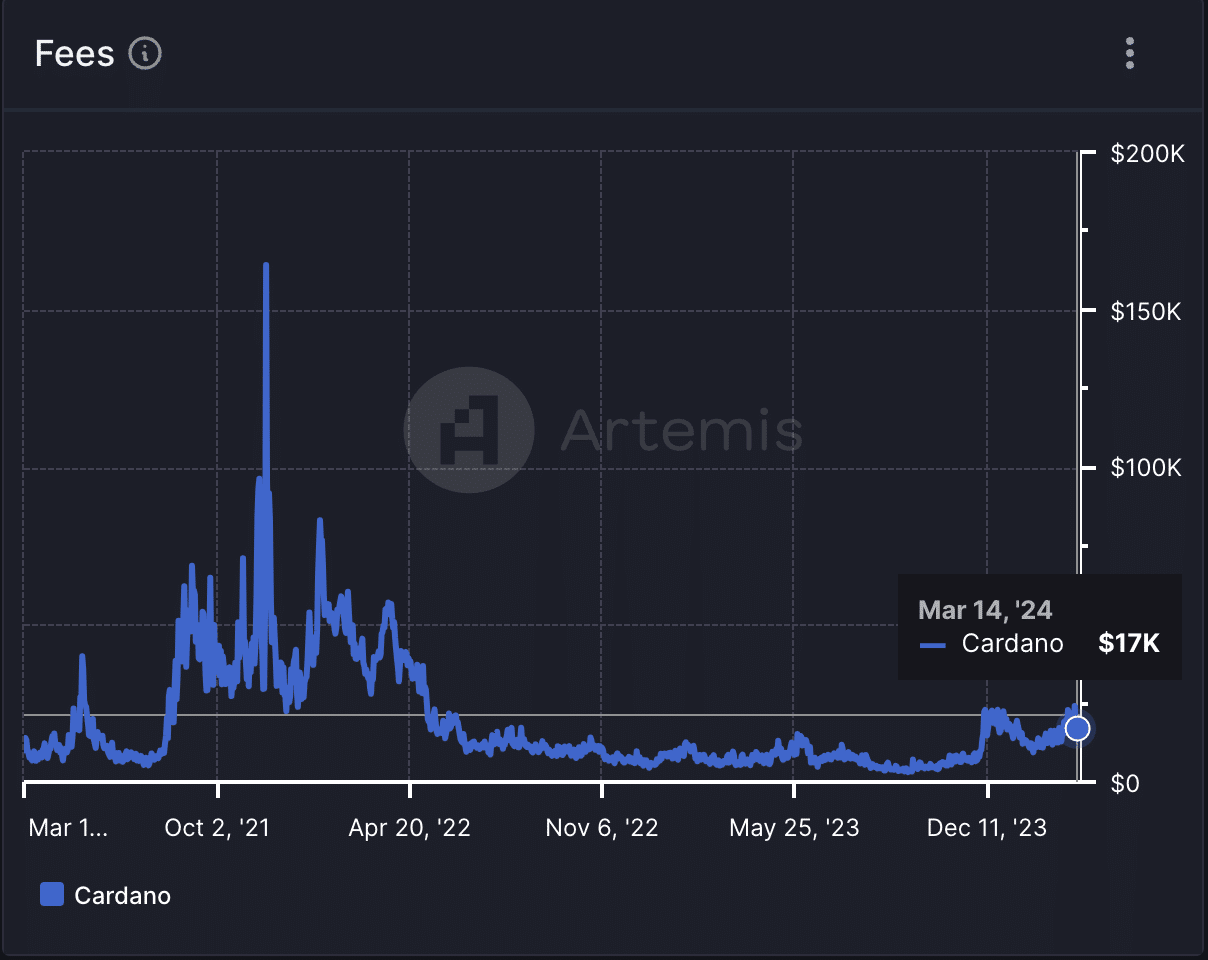
Due to the surge in user activity on the network since the beginning of the month, transaction fees also rallied. Per Artemis’ data, daily transaction fees on Cardano reached a two-year high of $17,000 on 14th March.
The last time its total transaction fee was that high was on 7th June 2022.


Source: Artemis
The bears re-emerge to take control
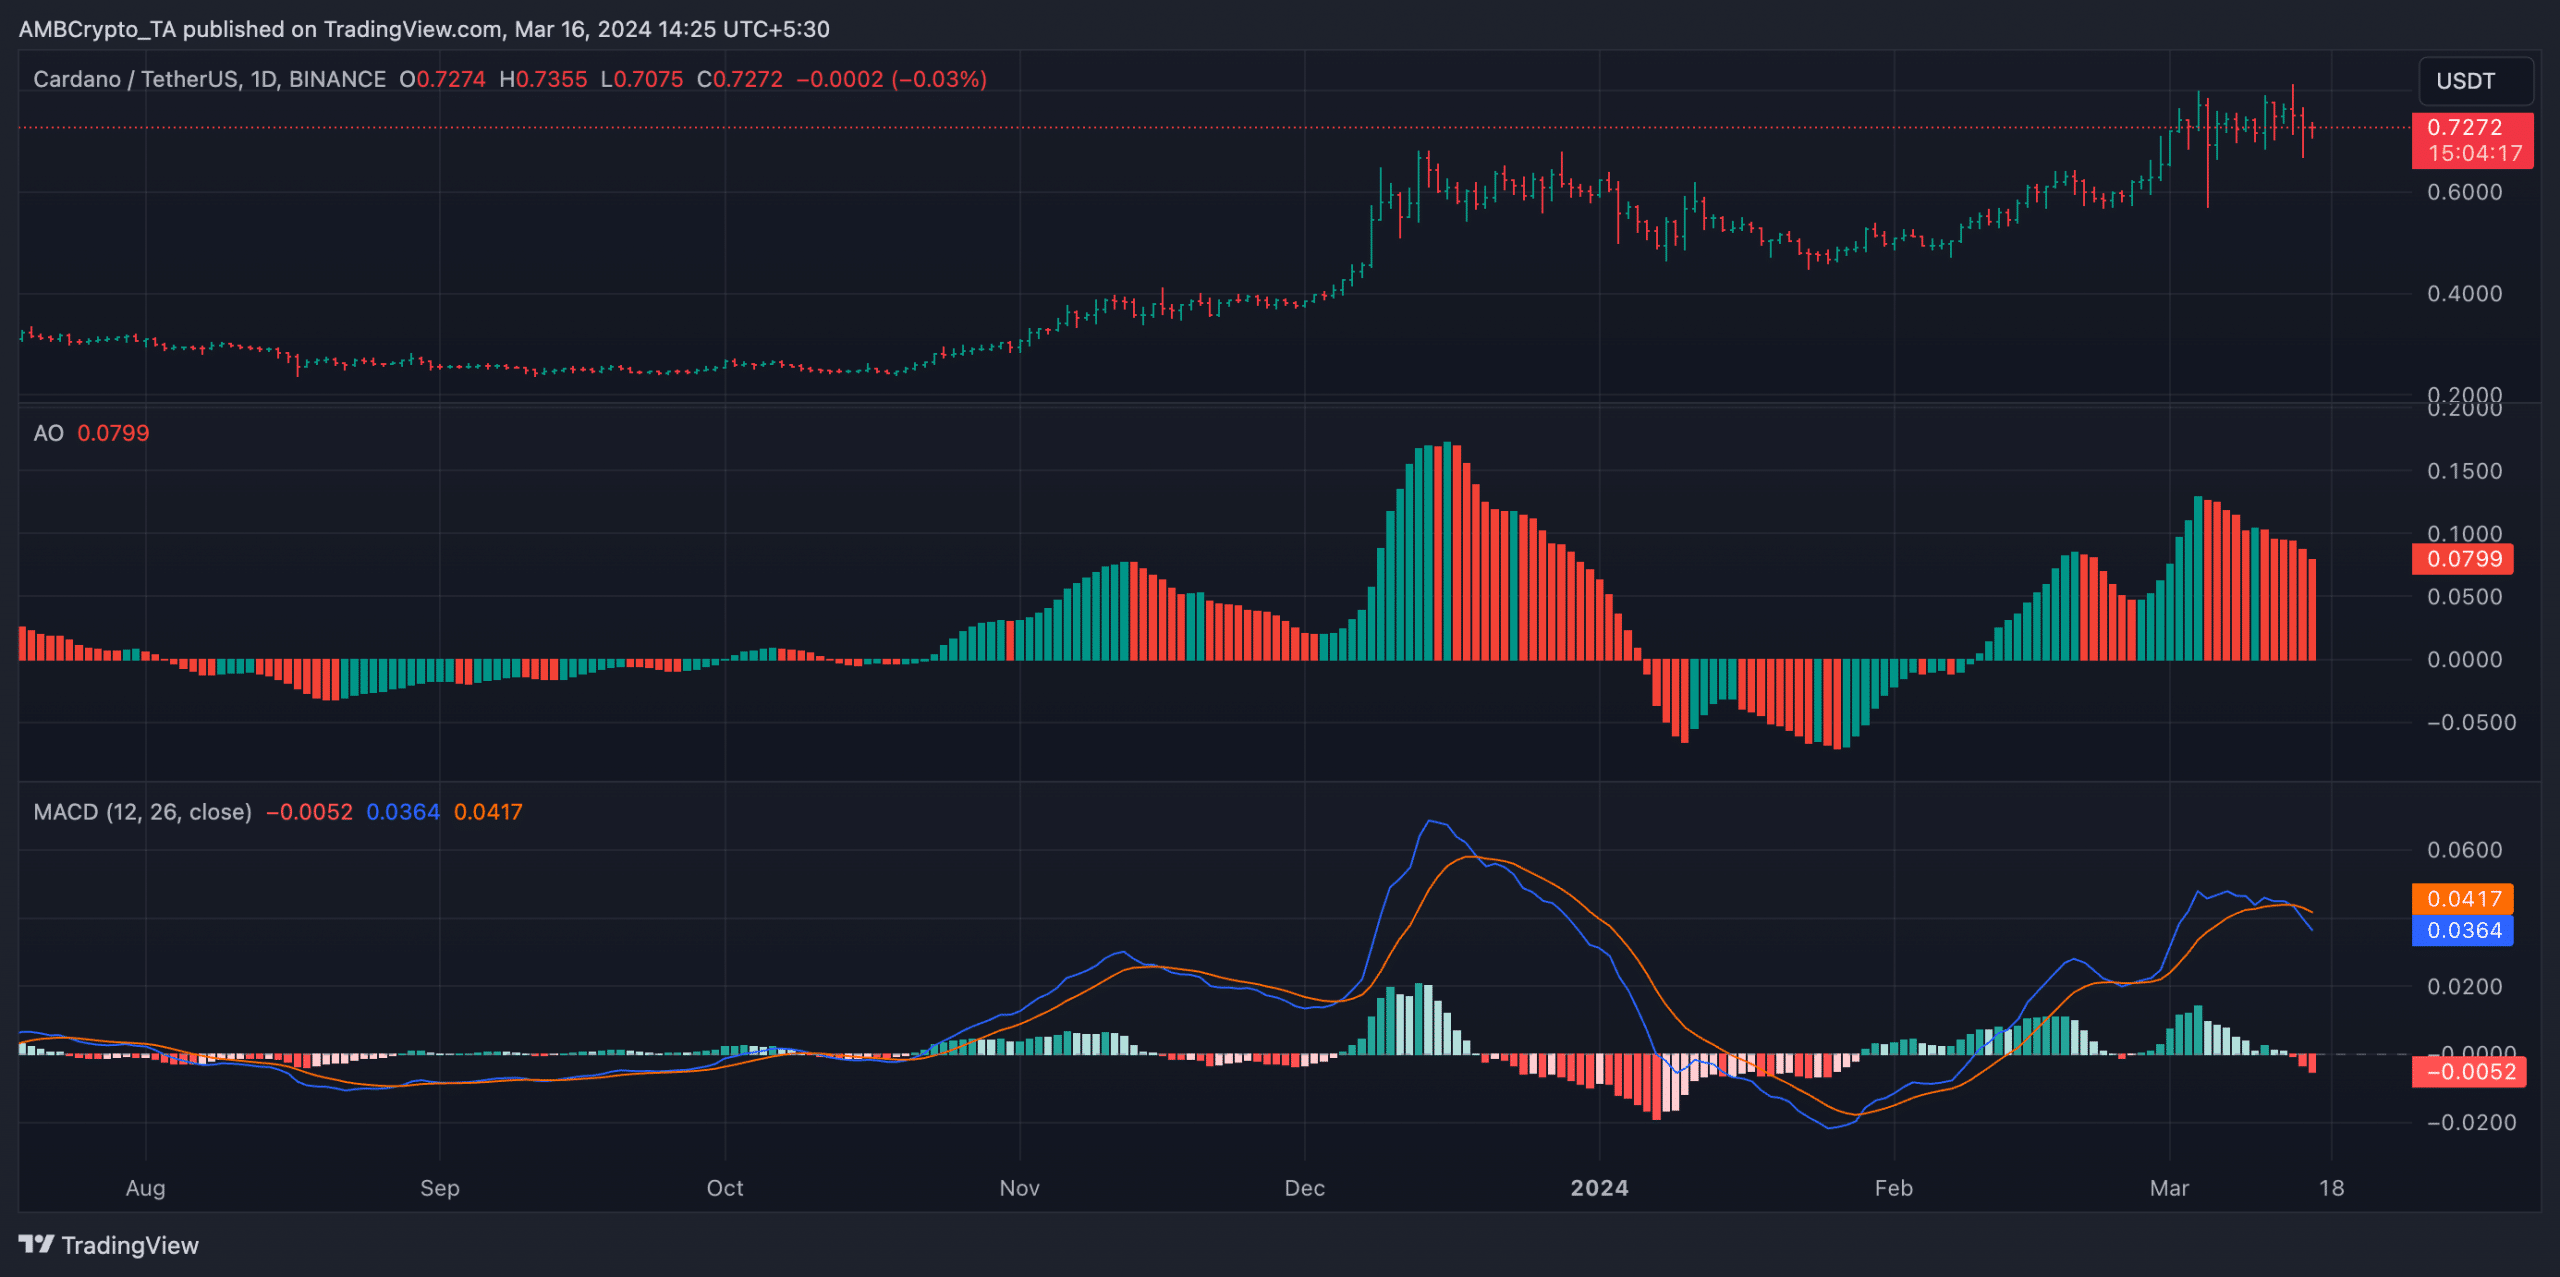
ADA exchanged hands at $0.73 at press time. While its value grew by double digits in the last month, the recent market drawback resulted in a buildup of bearish sentiments, which forced a minor correction in the altcoin’s price last week.
Per CoinMarketCap’s data, ADA’s price declined by 1% during that period.
An assessment of ADA’s price movements on a daily chart revealed a steady drop in bullish activity.
For example, by observing the coin’s Moving average convergence/divergence (MACD) indicator, AMBCrypto found that its signal line crossed above the MACD line on 14th March.
When the trend line intersects the MACD line in an uptrend, it implies that the shorter-term moving average is declining at a faster rate than the longer-term moving average.
Read Cardano’s [ADA] Price Prediction 2023-24
This crossover suggests a potential shift towards bearish momentum and is often followed by a downtrend in price action.
Further, the state of ADA’s Awesome Oscillator (AO) indicator confirmed the bearish state of its daily market. The indicator returned red upward-facing bars in the past five days.


Source: TradingView
When an AO posts these bars, it hints at a shift in momentum towards the downside. Traders see it as a signal to sell or exit long positions and enter short positions to profit from a potential price decline.


Leave a Reply